Install UptimeKuma
UptimeKuma is the self hosted version of Uptime Robot that check for website availability with easy to digest report.
Quick Info
| Web UI | http://<UNRAID_IP>:3001 |
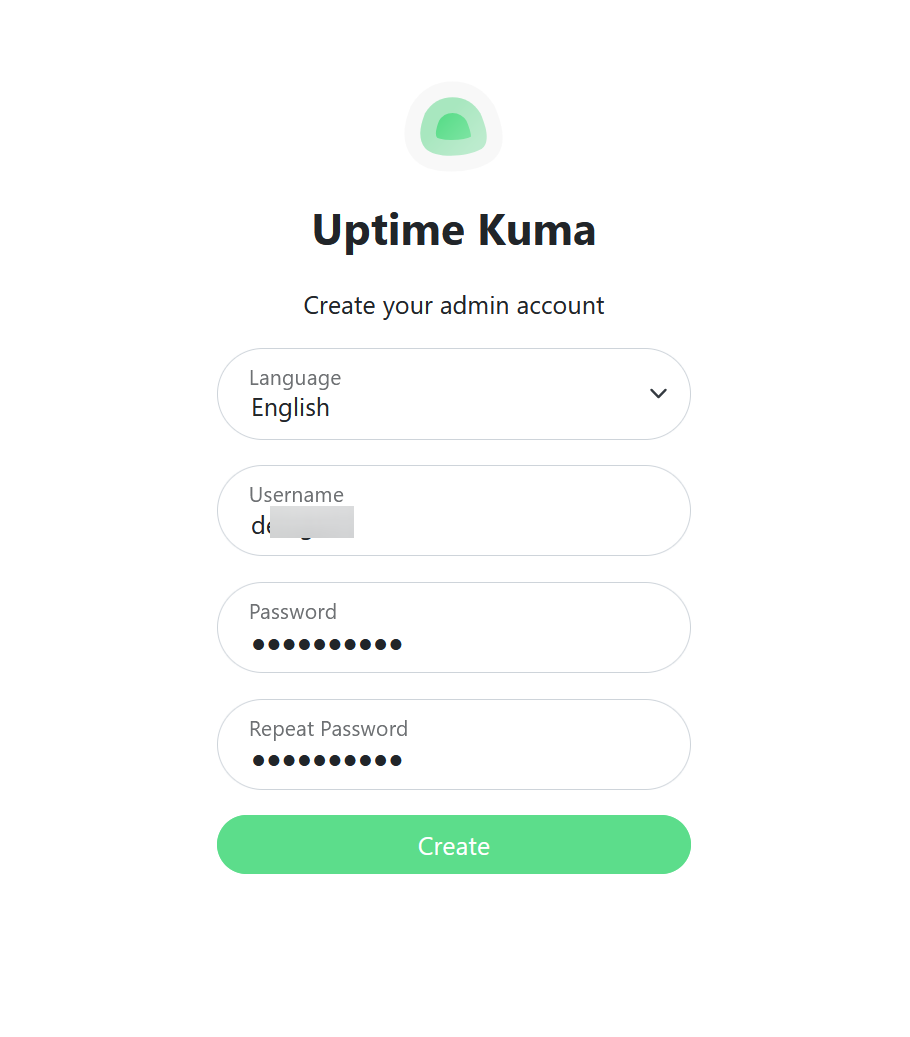
| Admin Username | Create on first launch |
| Admin Password | Create on first launch |
Alternatives
There exist other tools too such as Monitorr, but many and myself included think Uptime Kuma is way simpler and has intuitive dashboard.
Install on unRAID
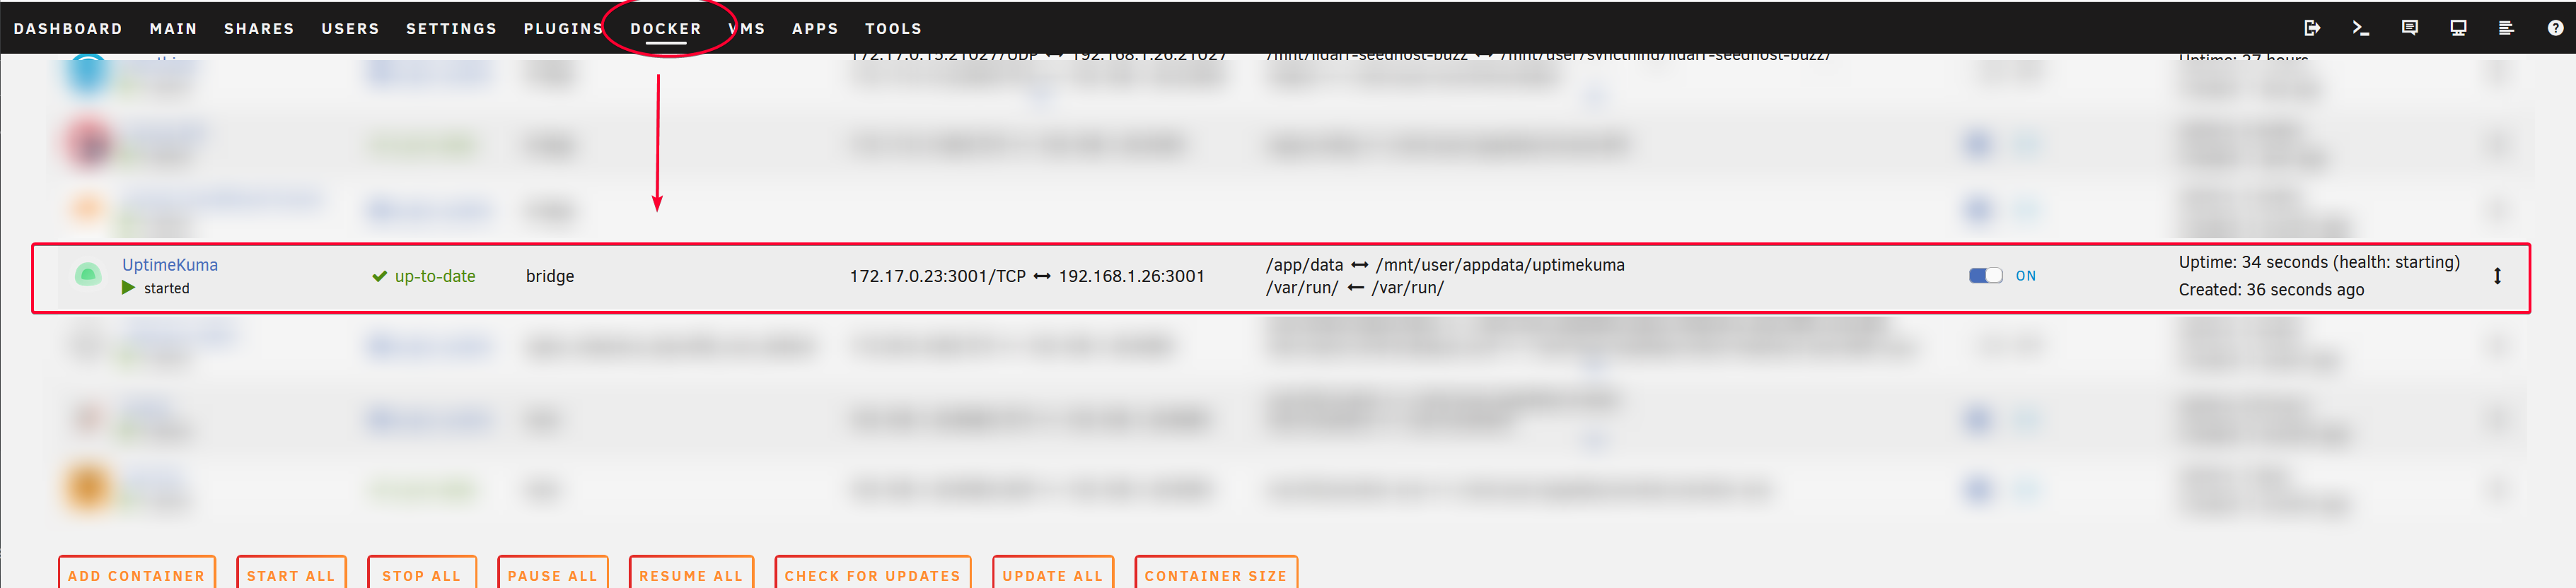
Search for uptimekuma on unRAID Apps.
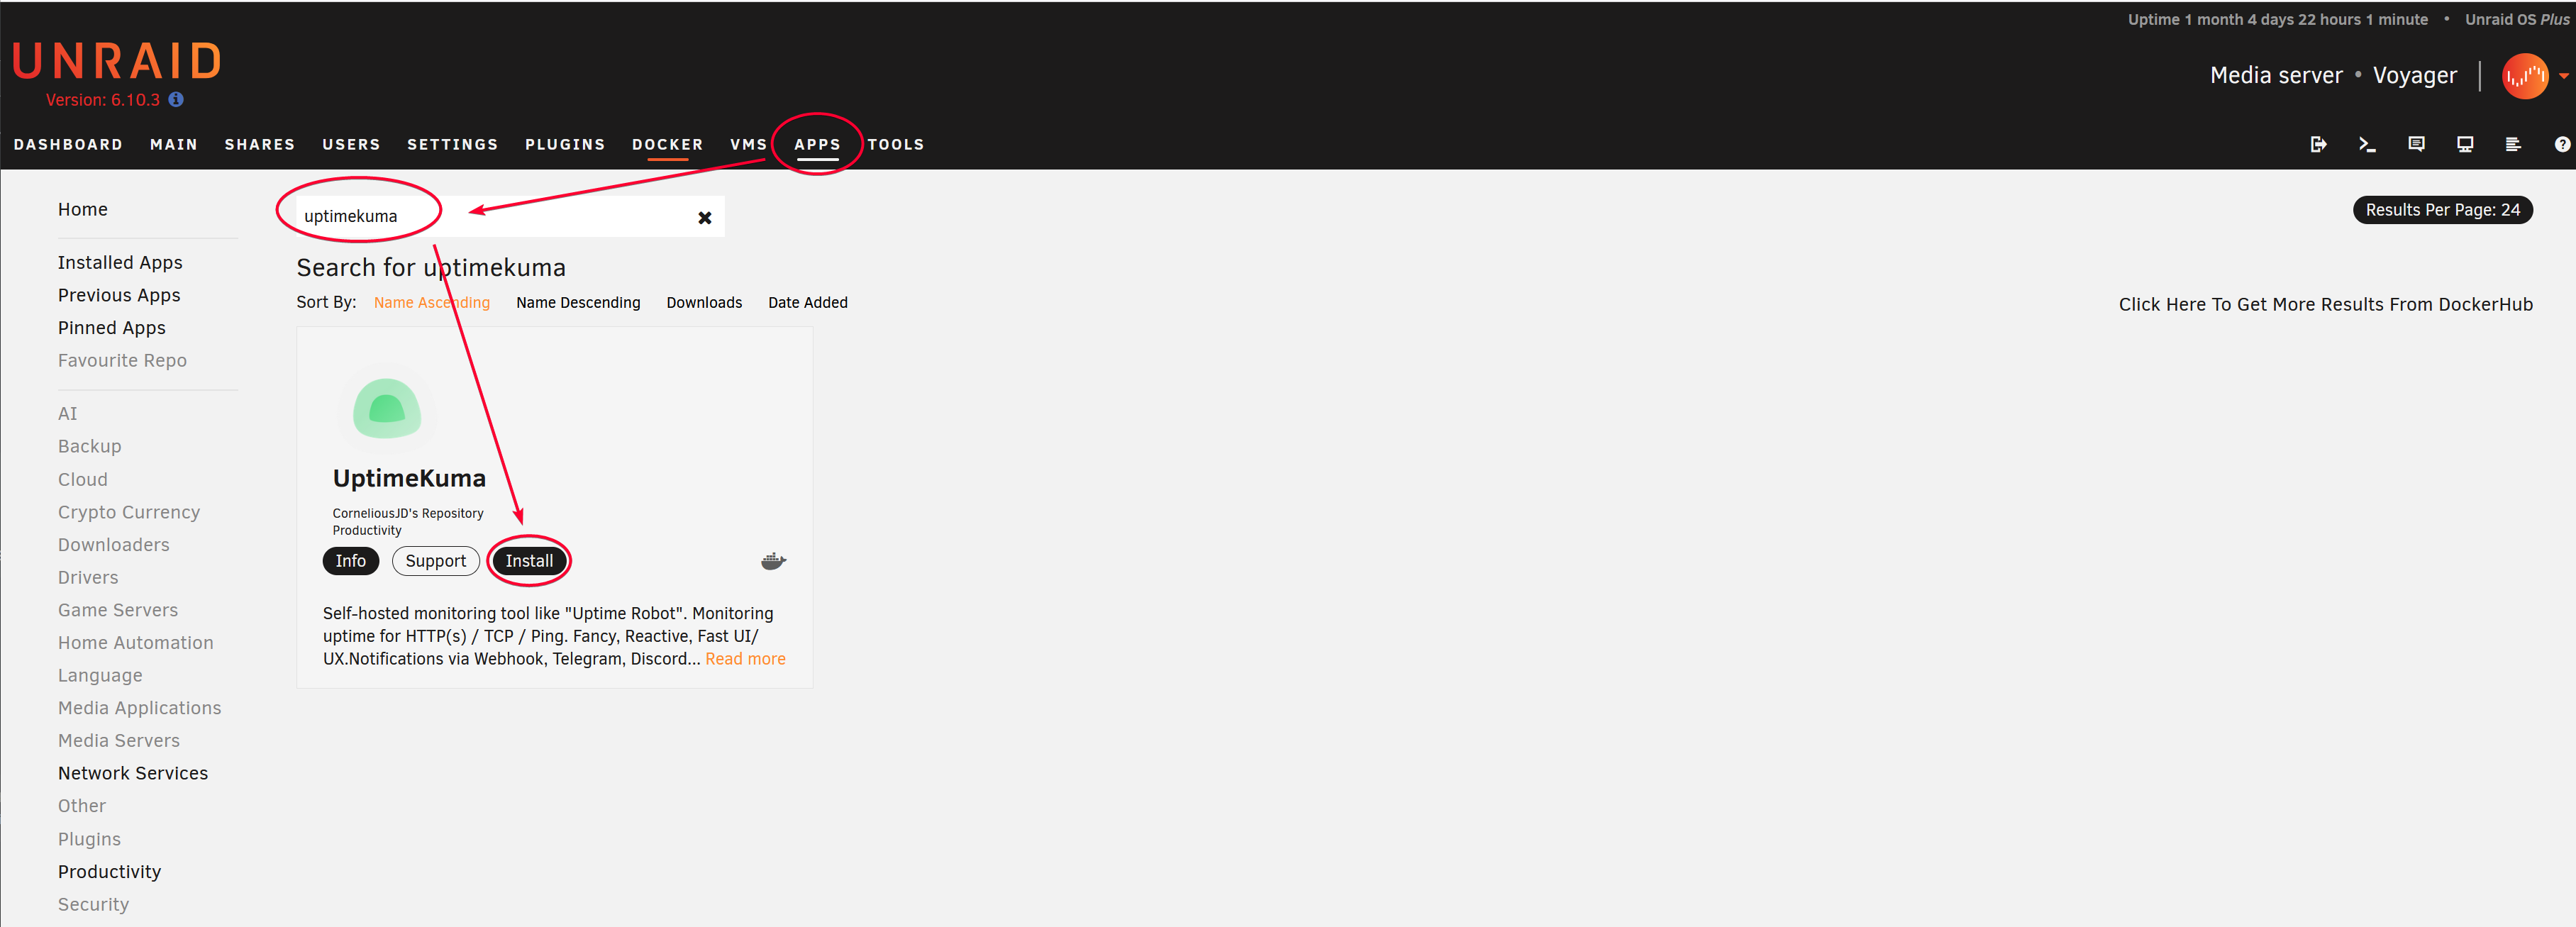
Click the Apply button, there is no need to edit any field in the template.
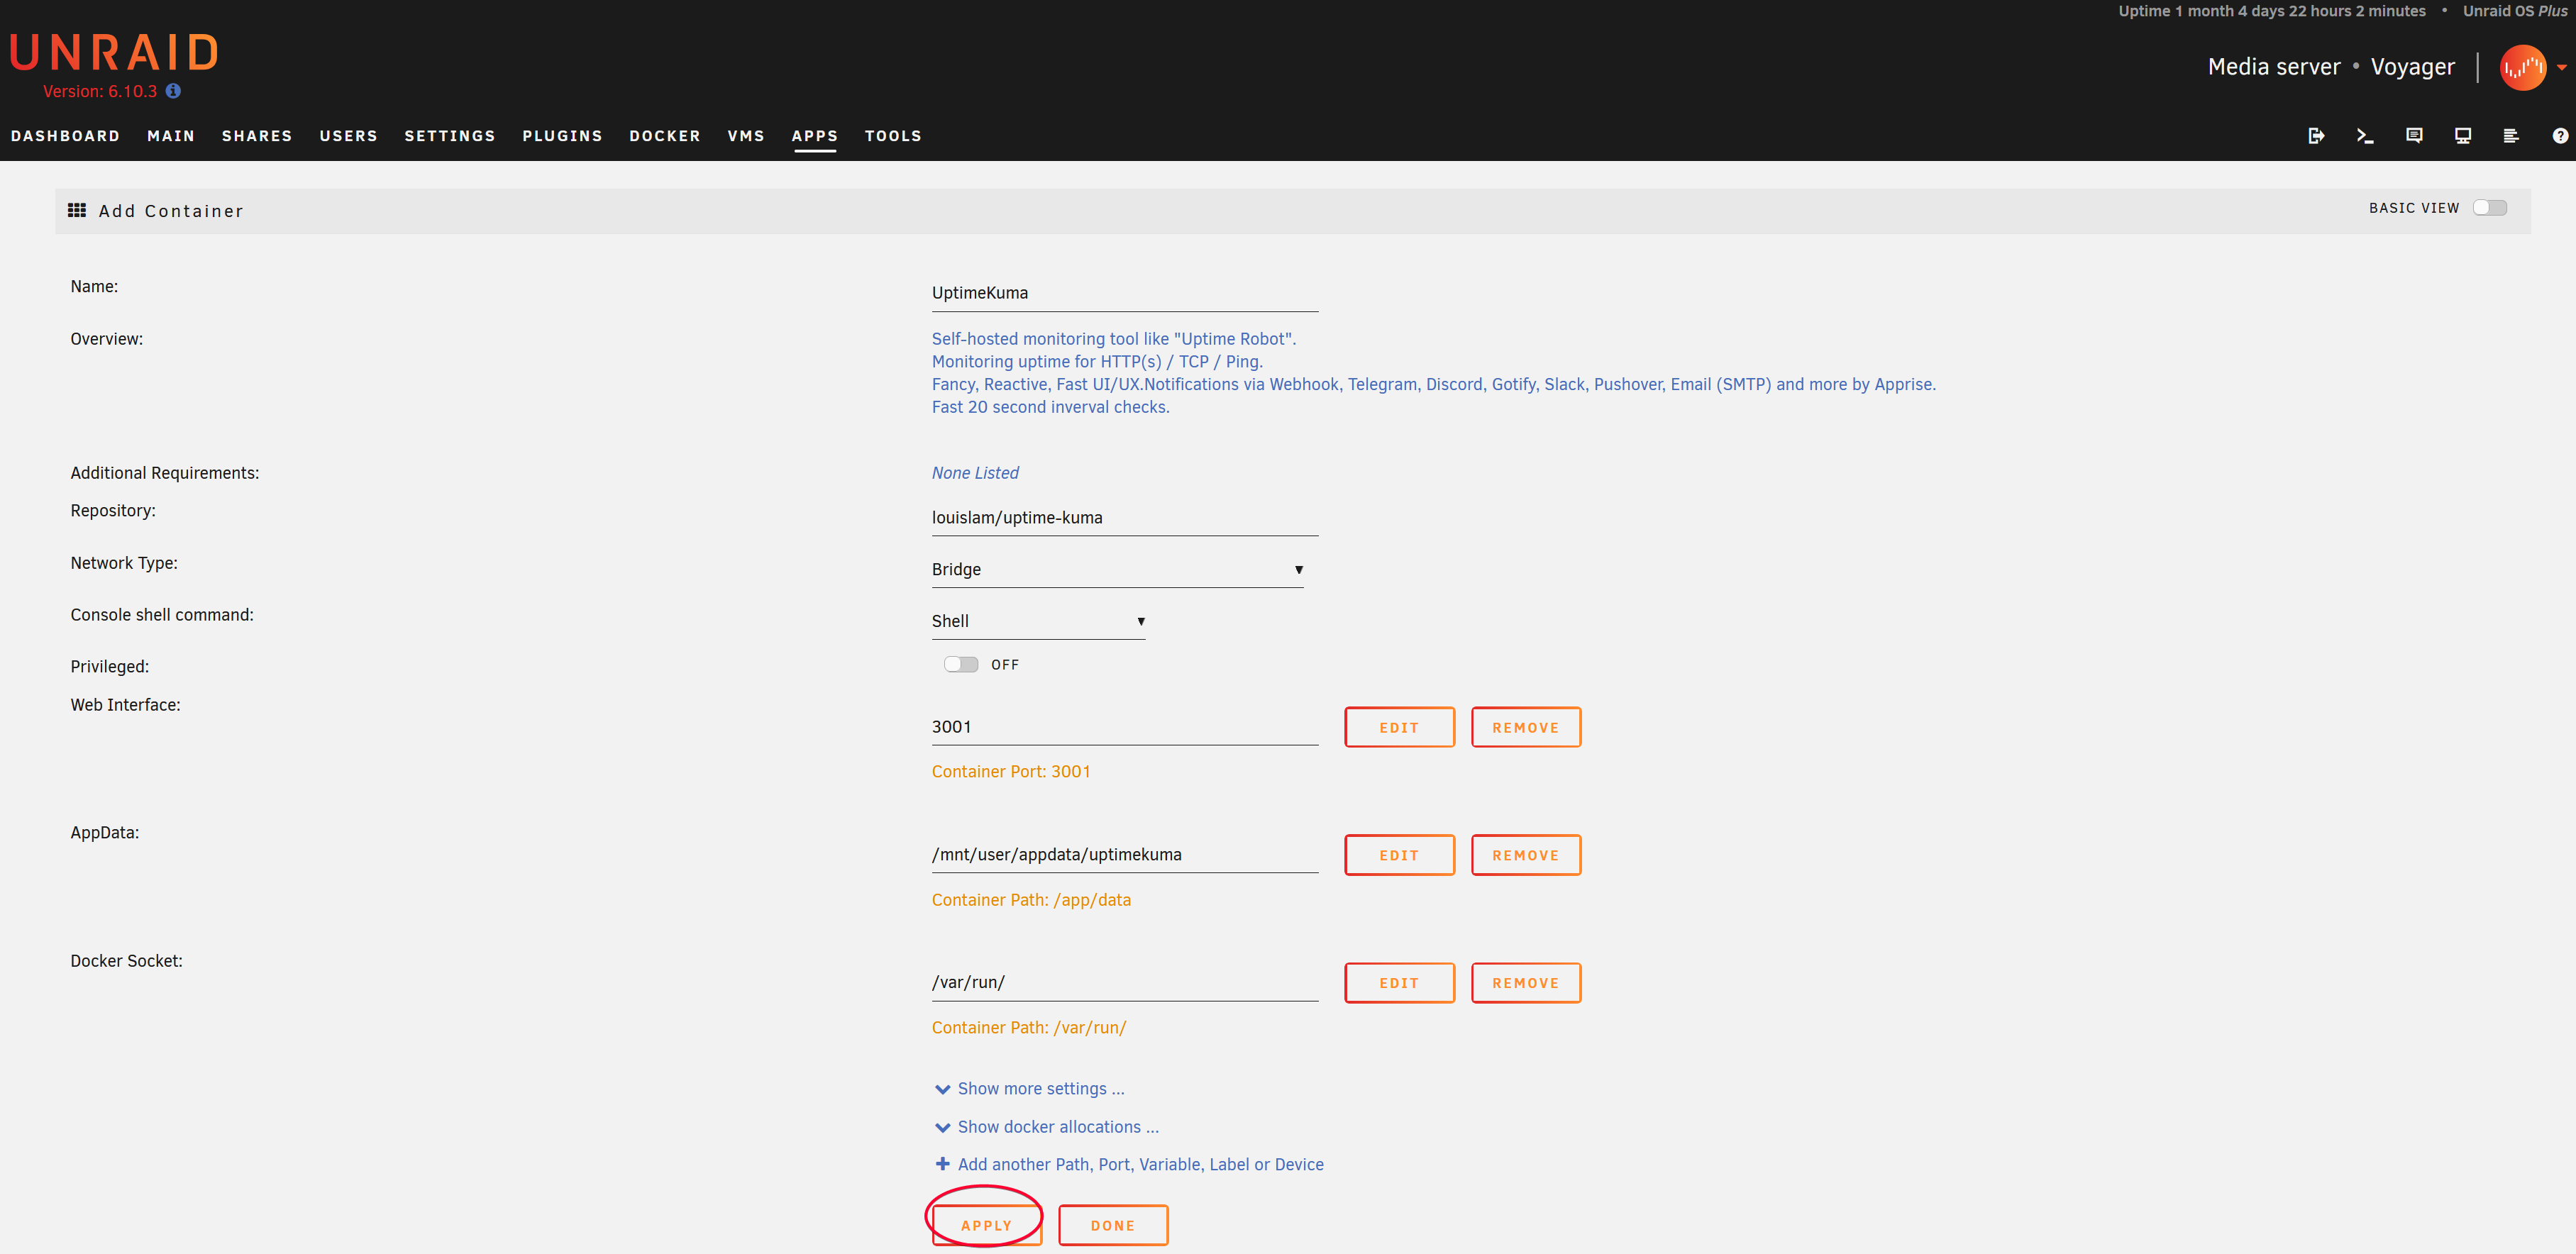
Check that it is up and running.
Customize
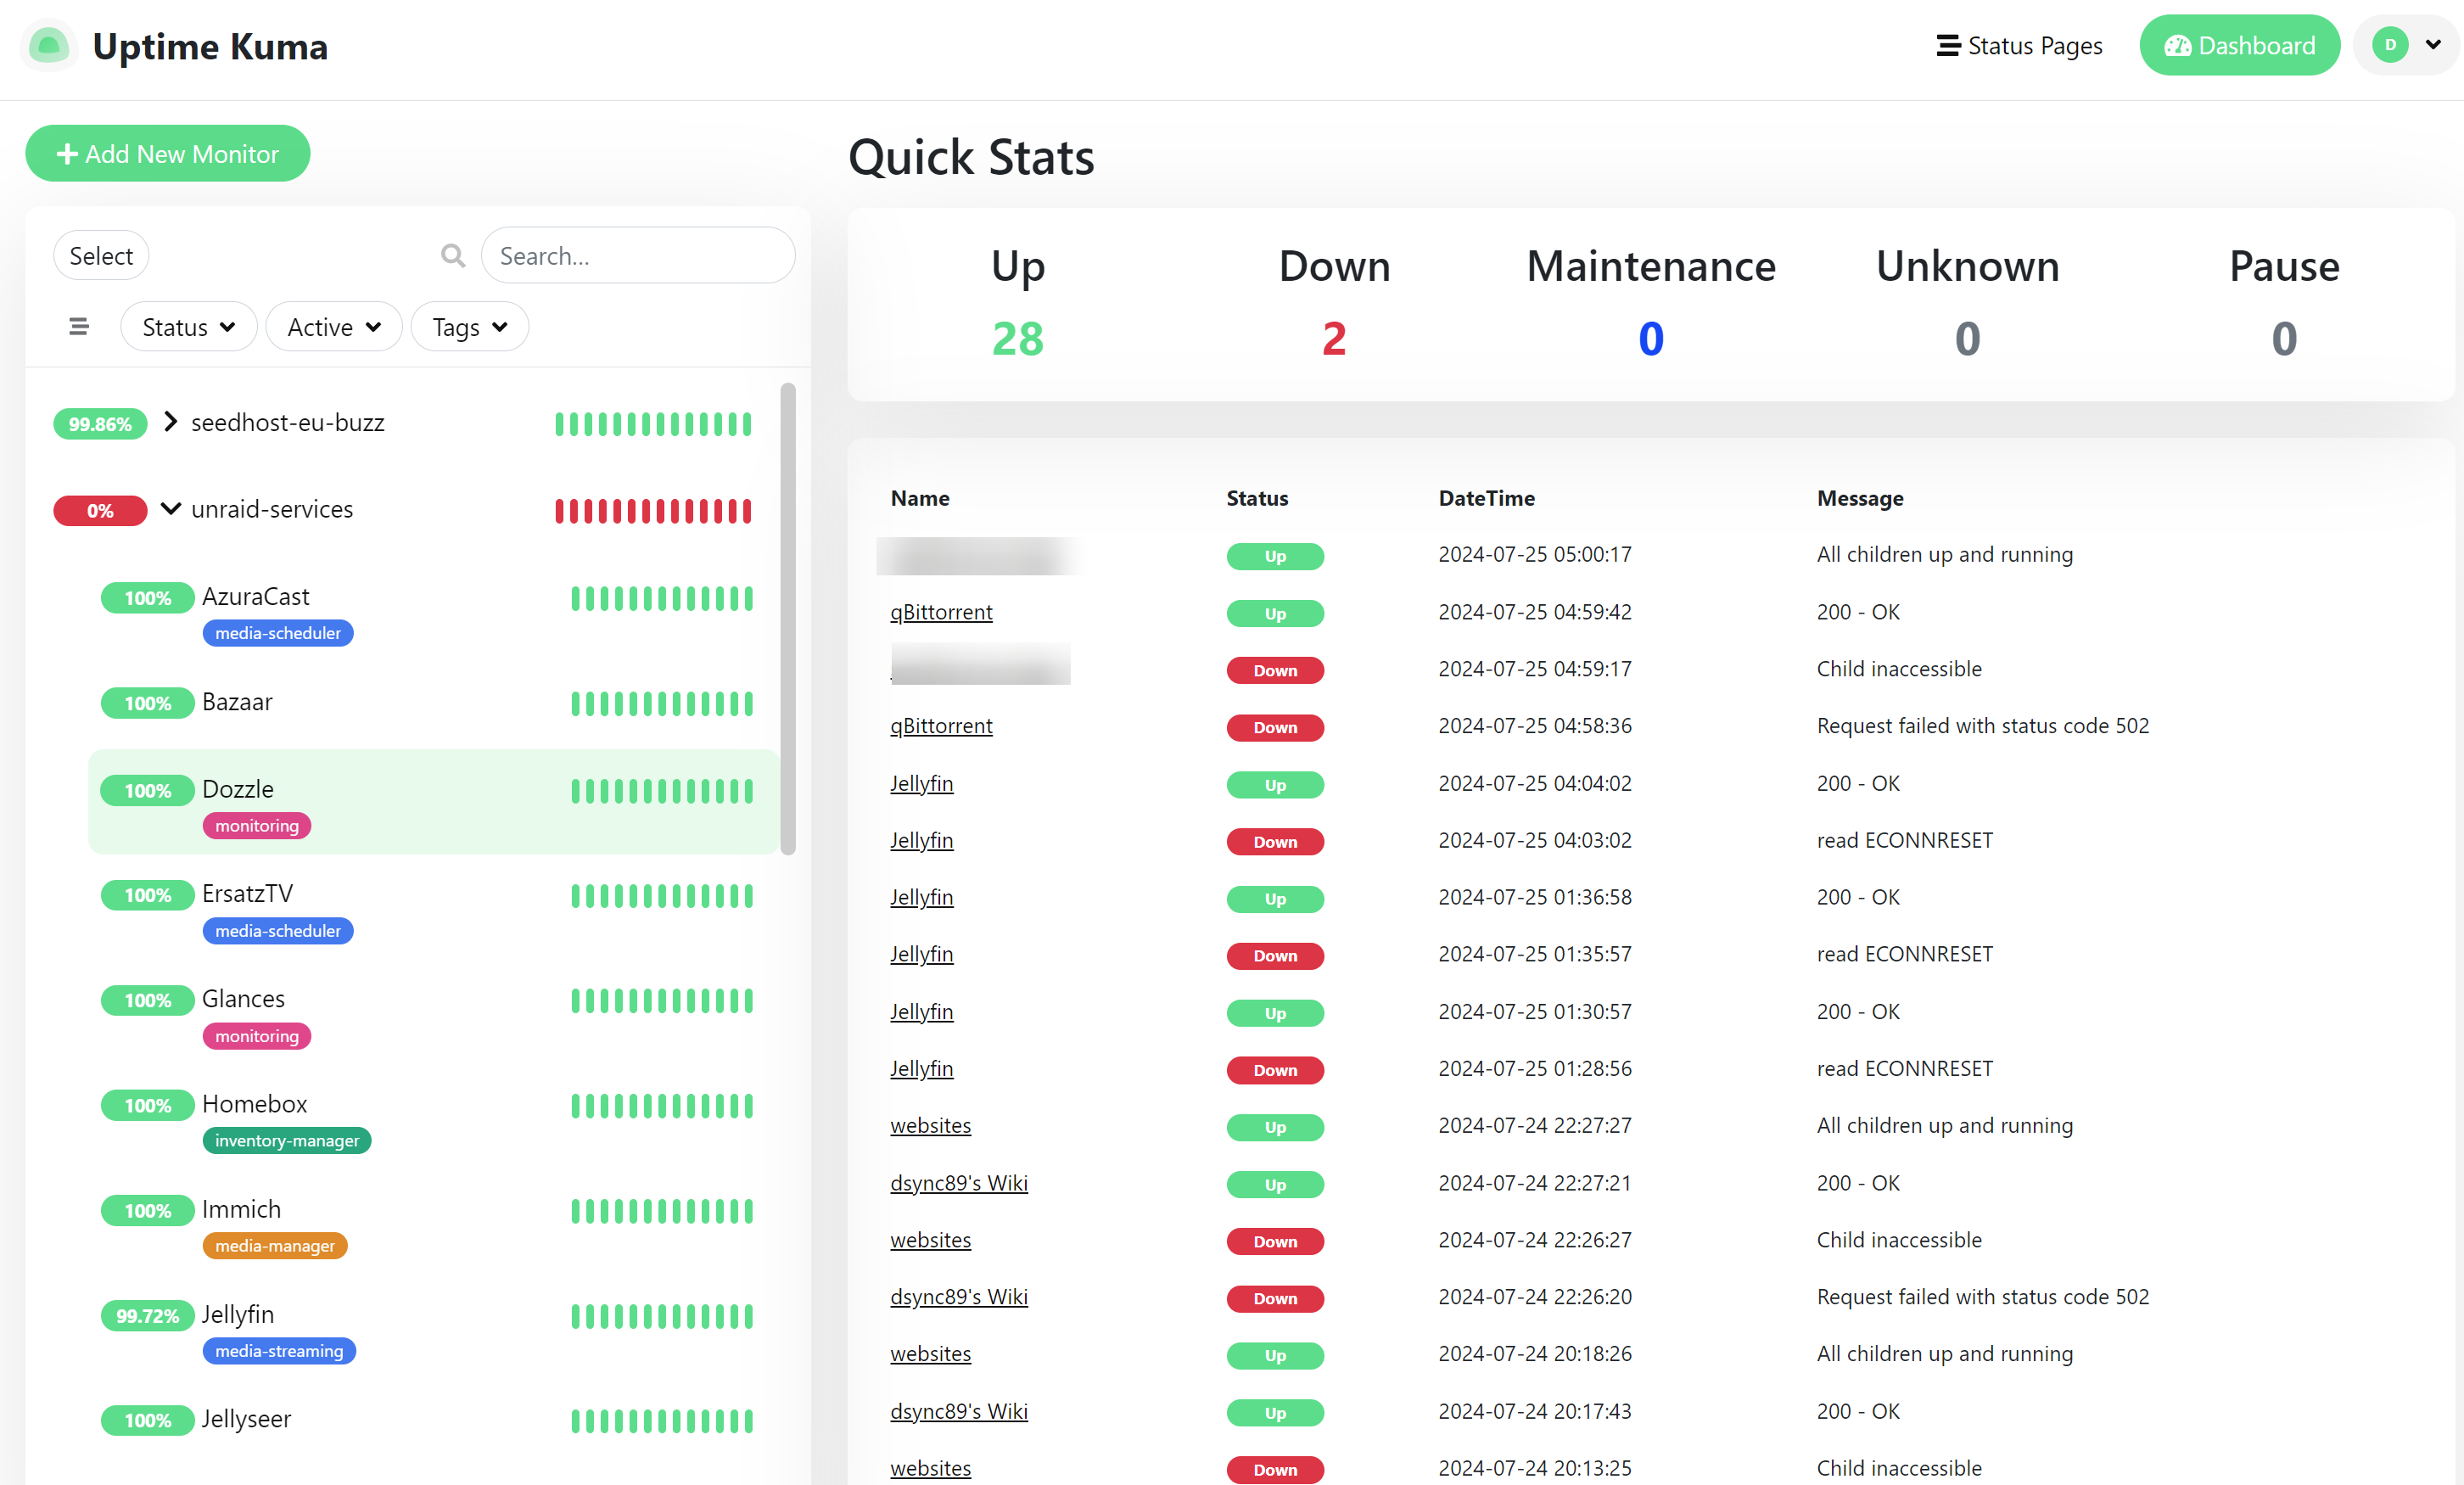
Dashboard

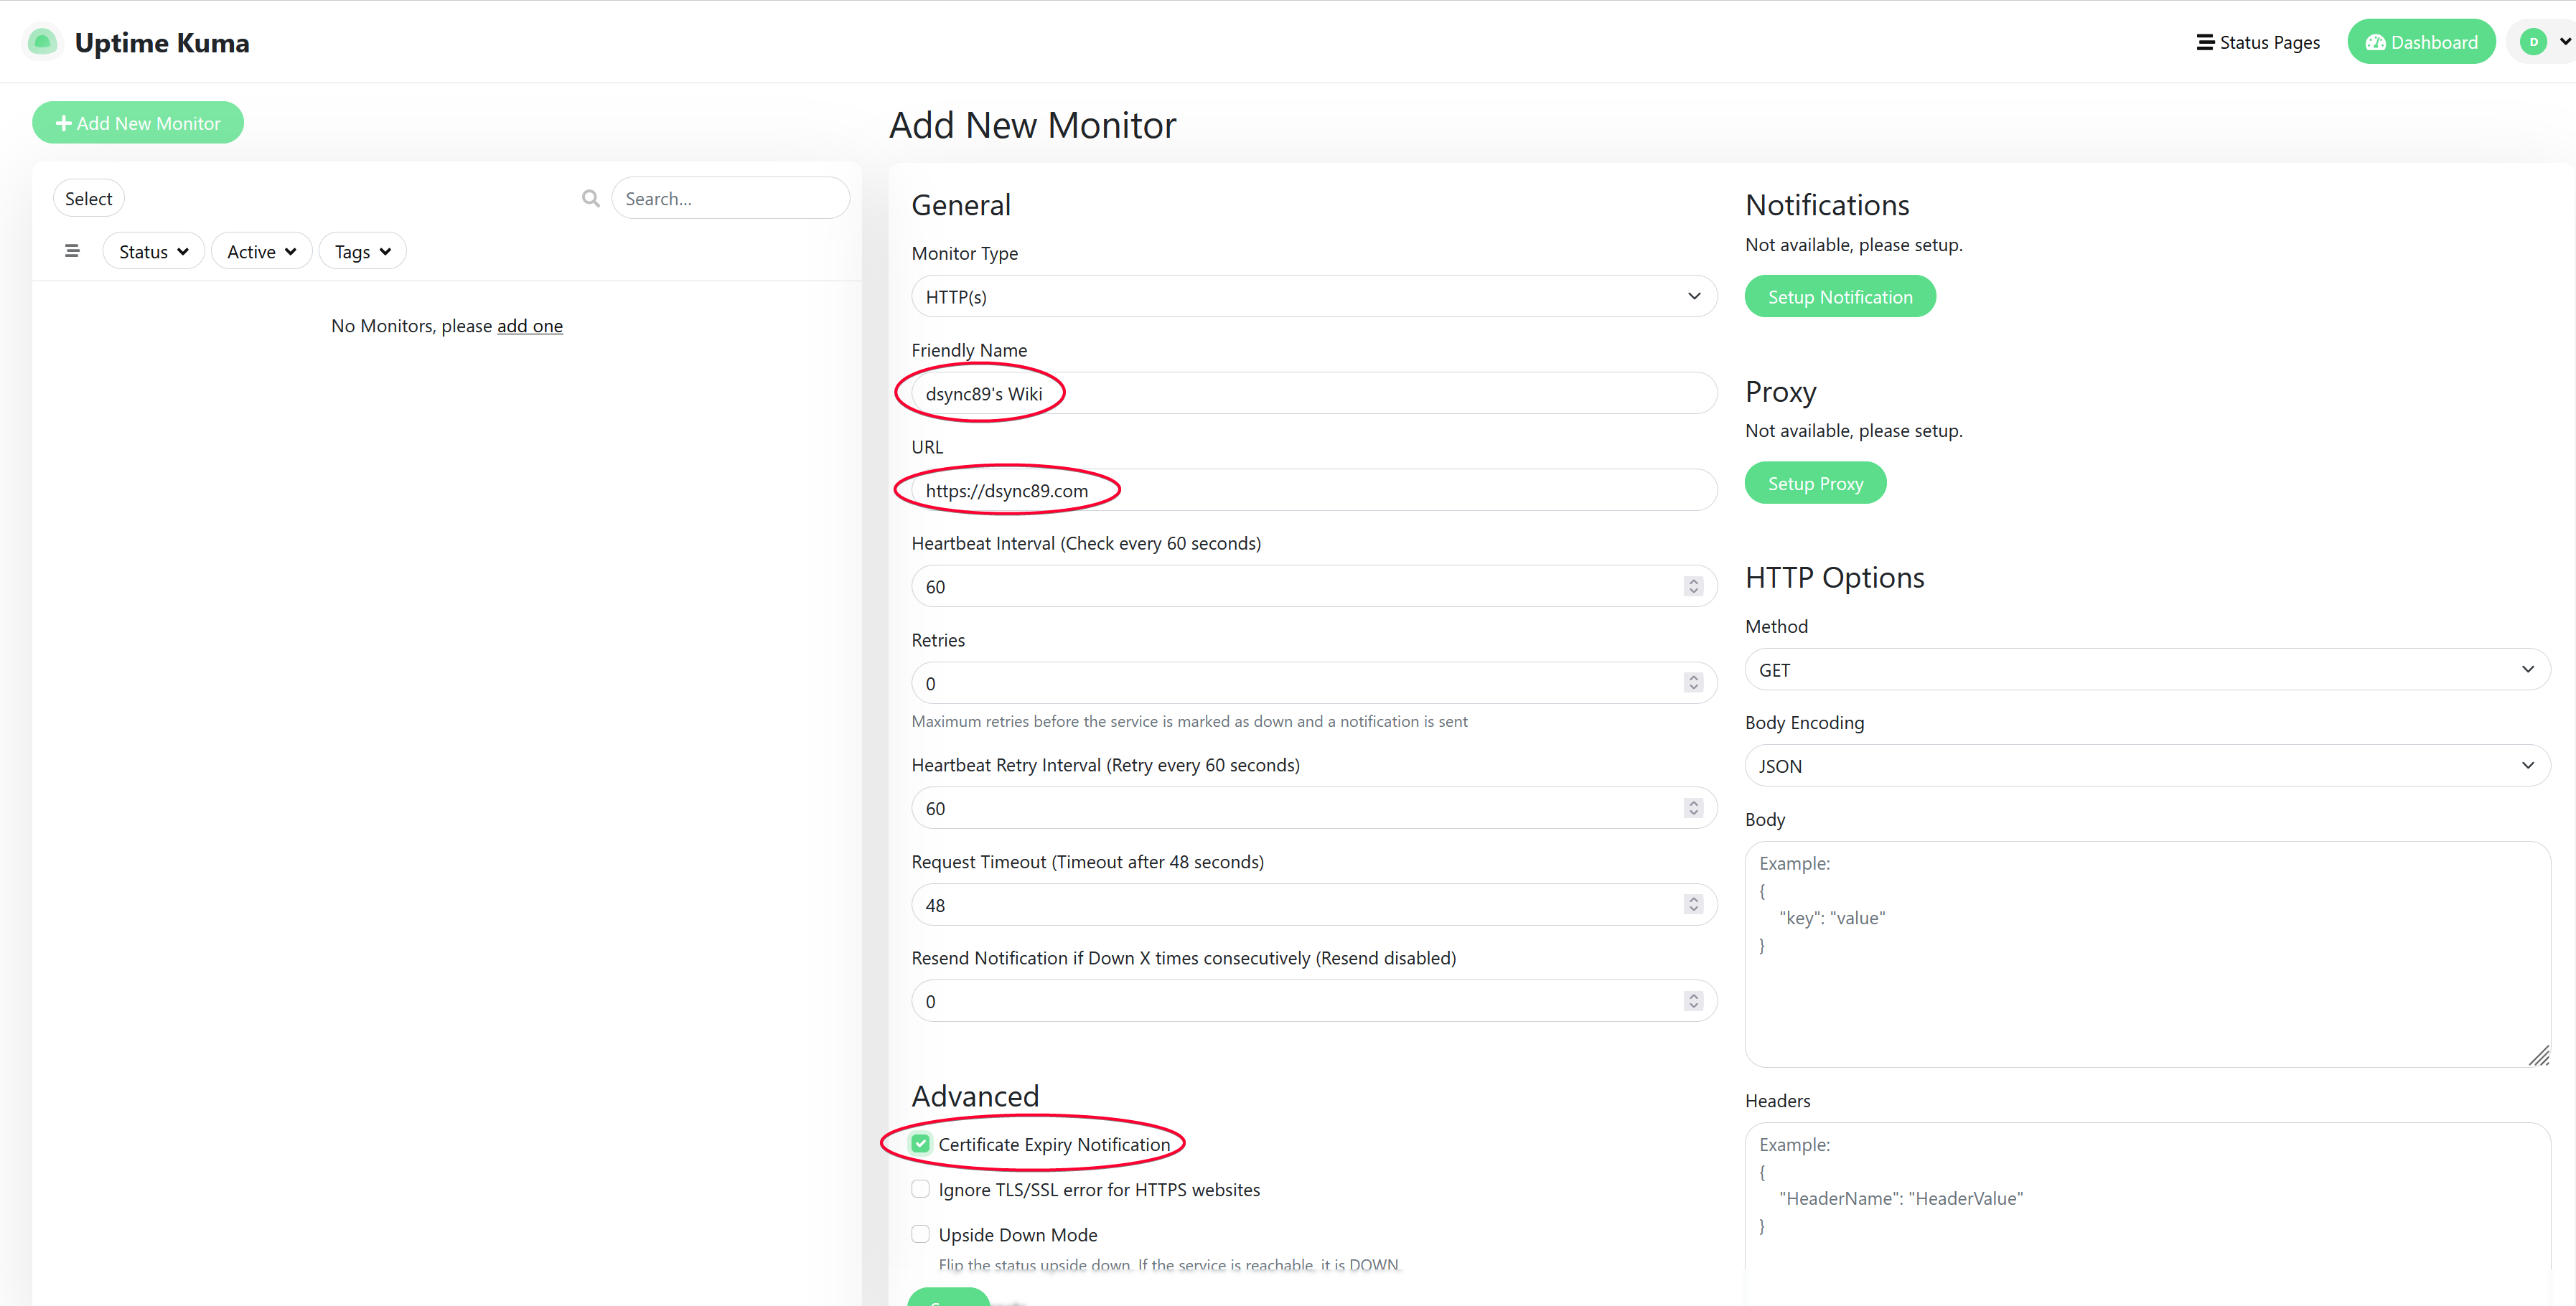
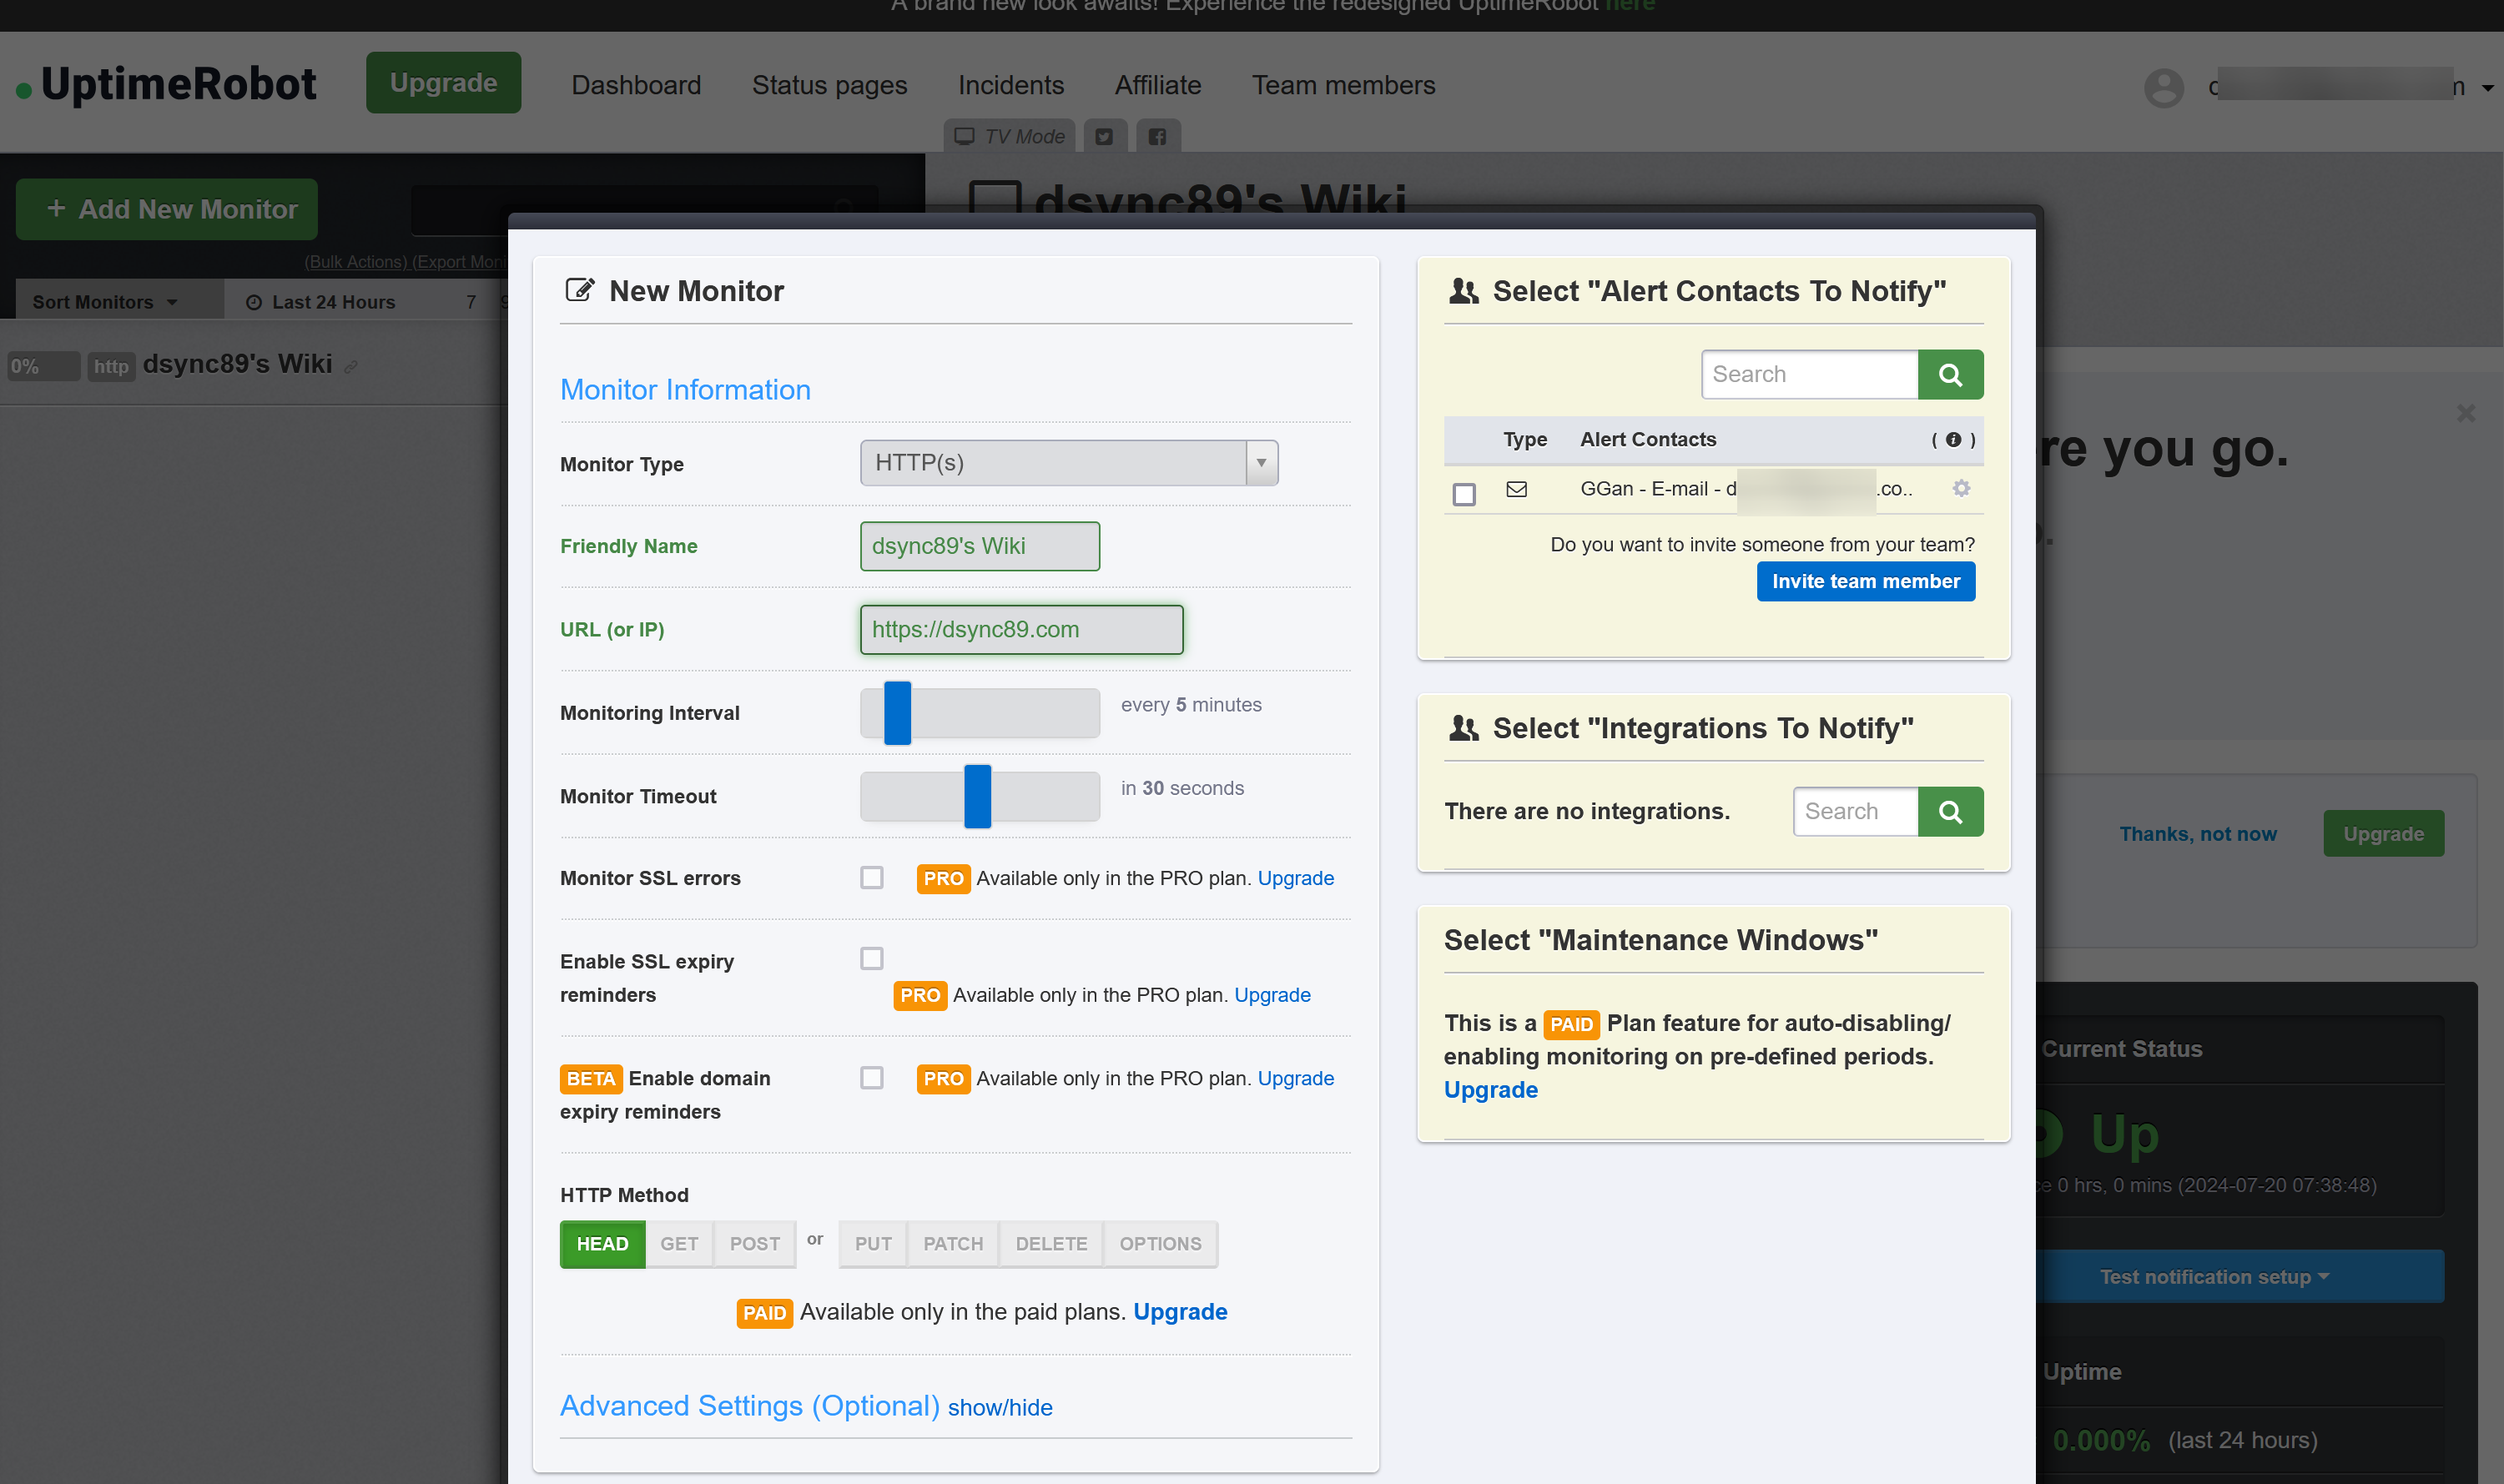
Create First Service Monitor
Let’s monitor my wiki site, https://dsync89.com
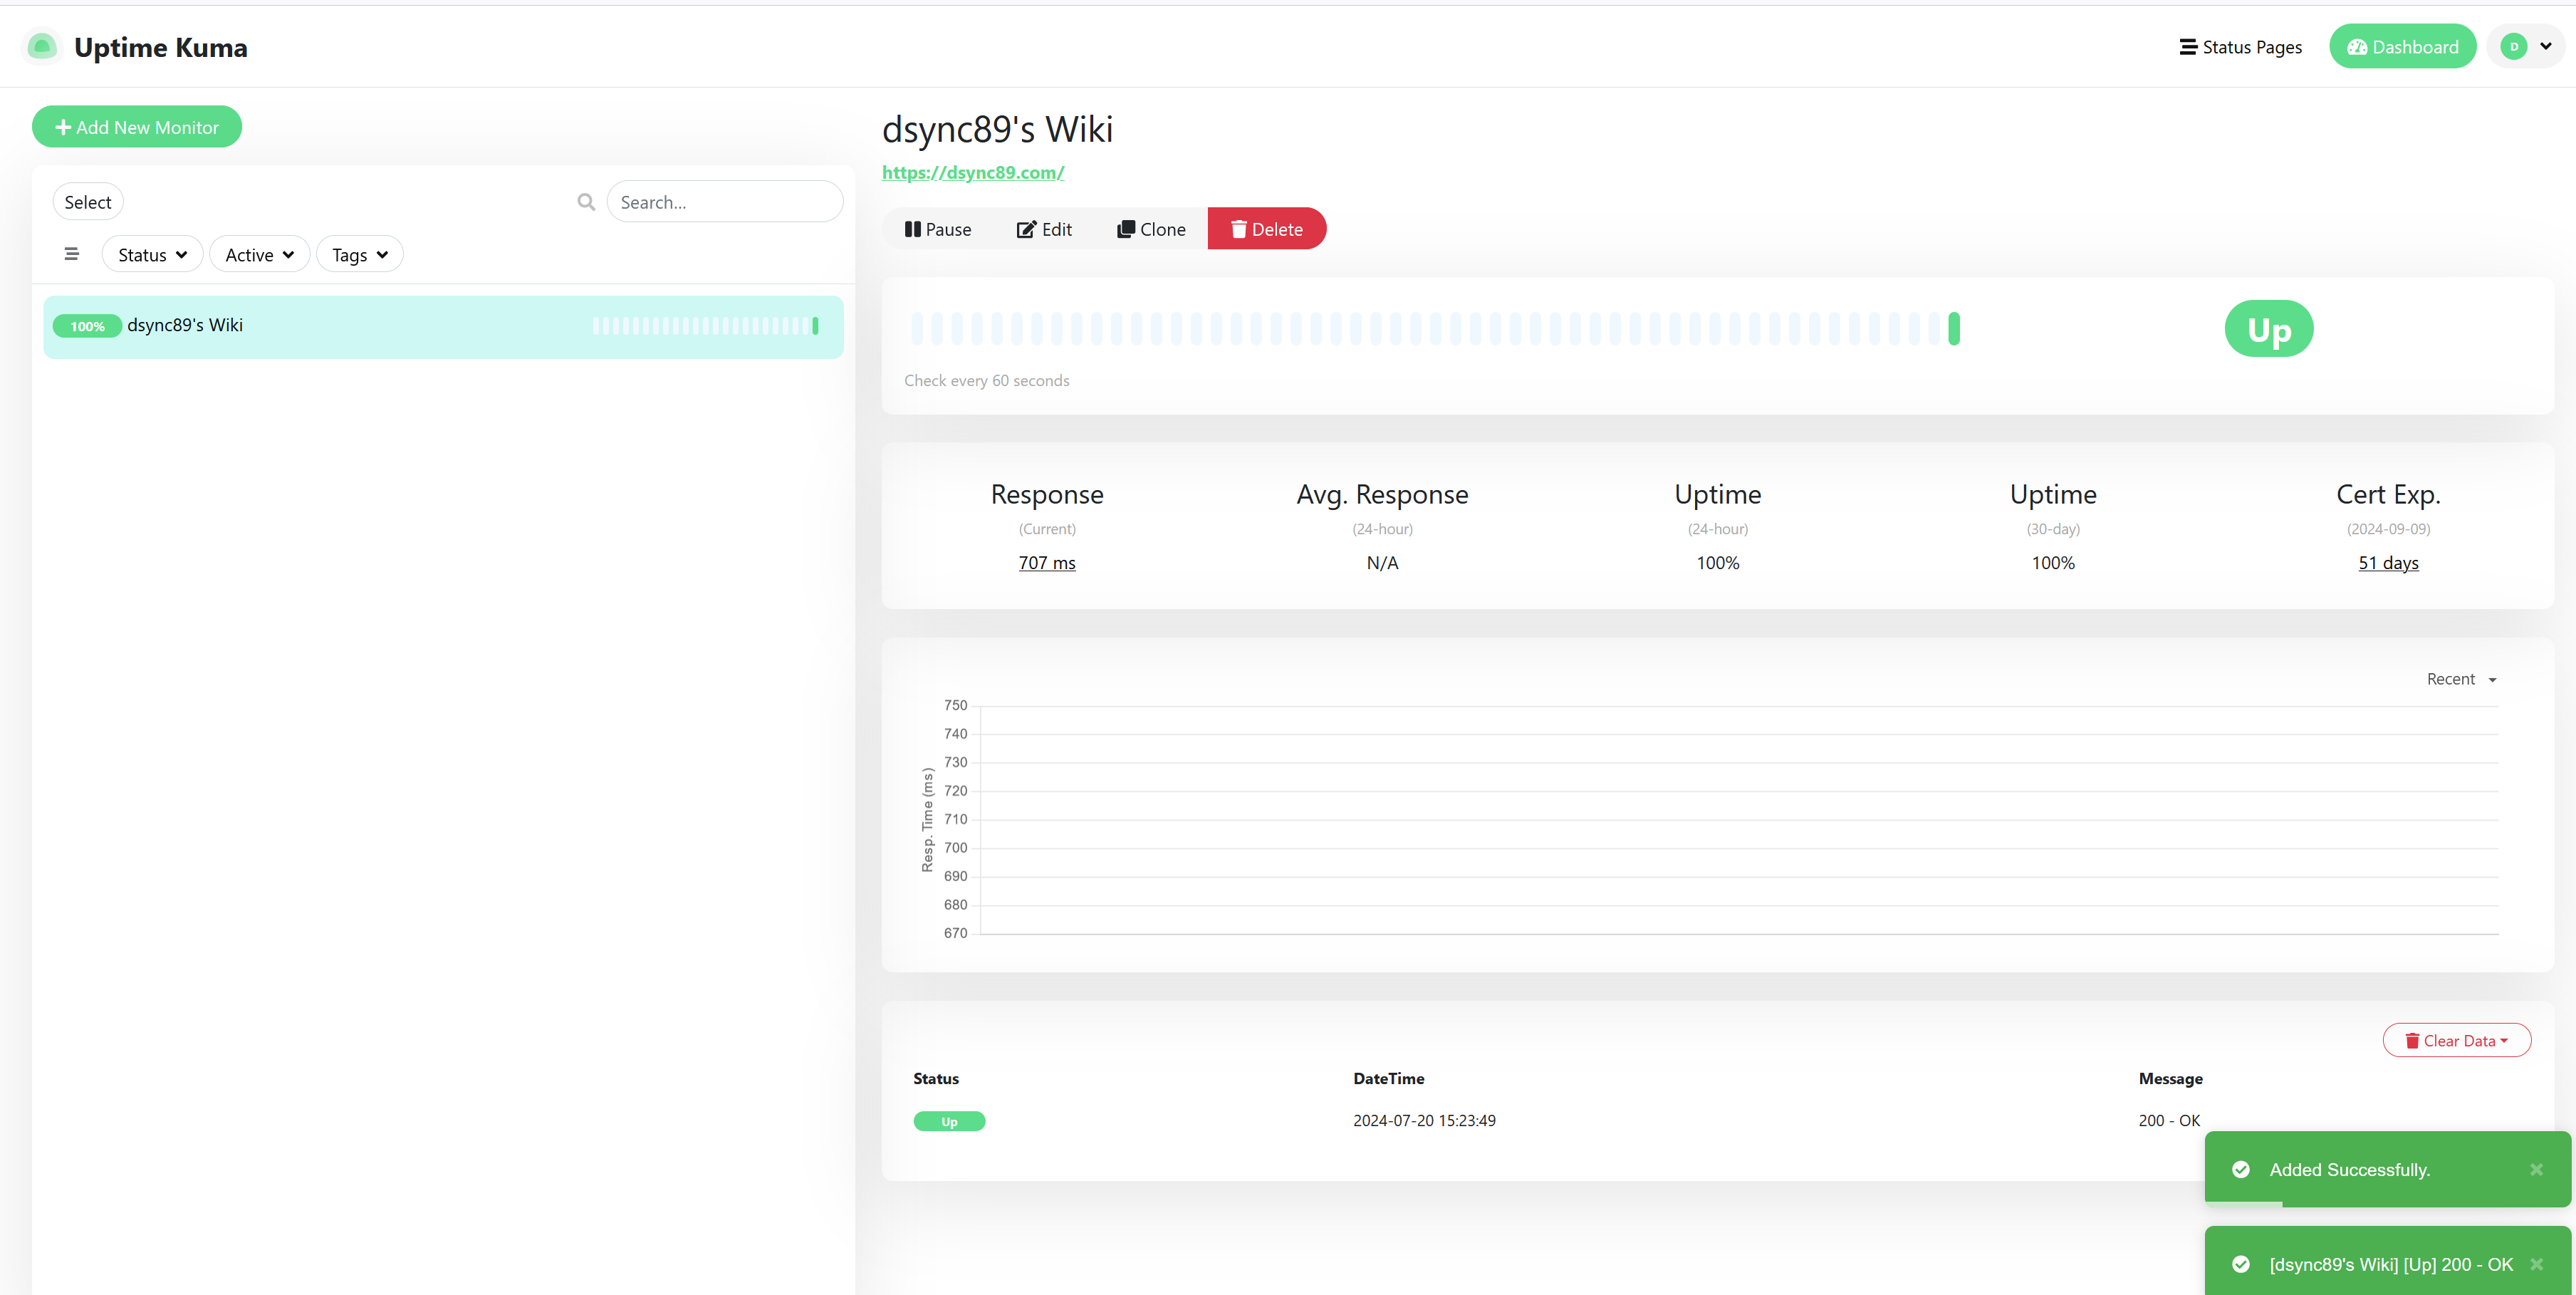
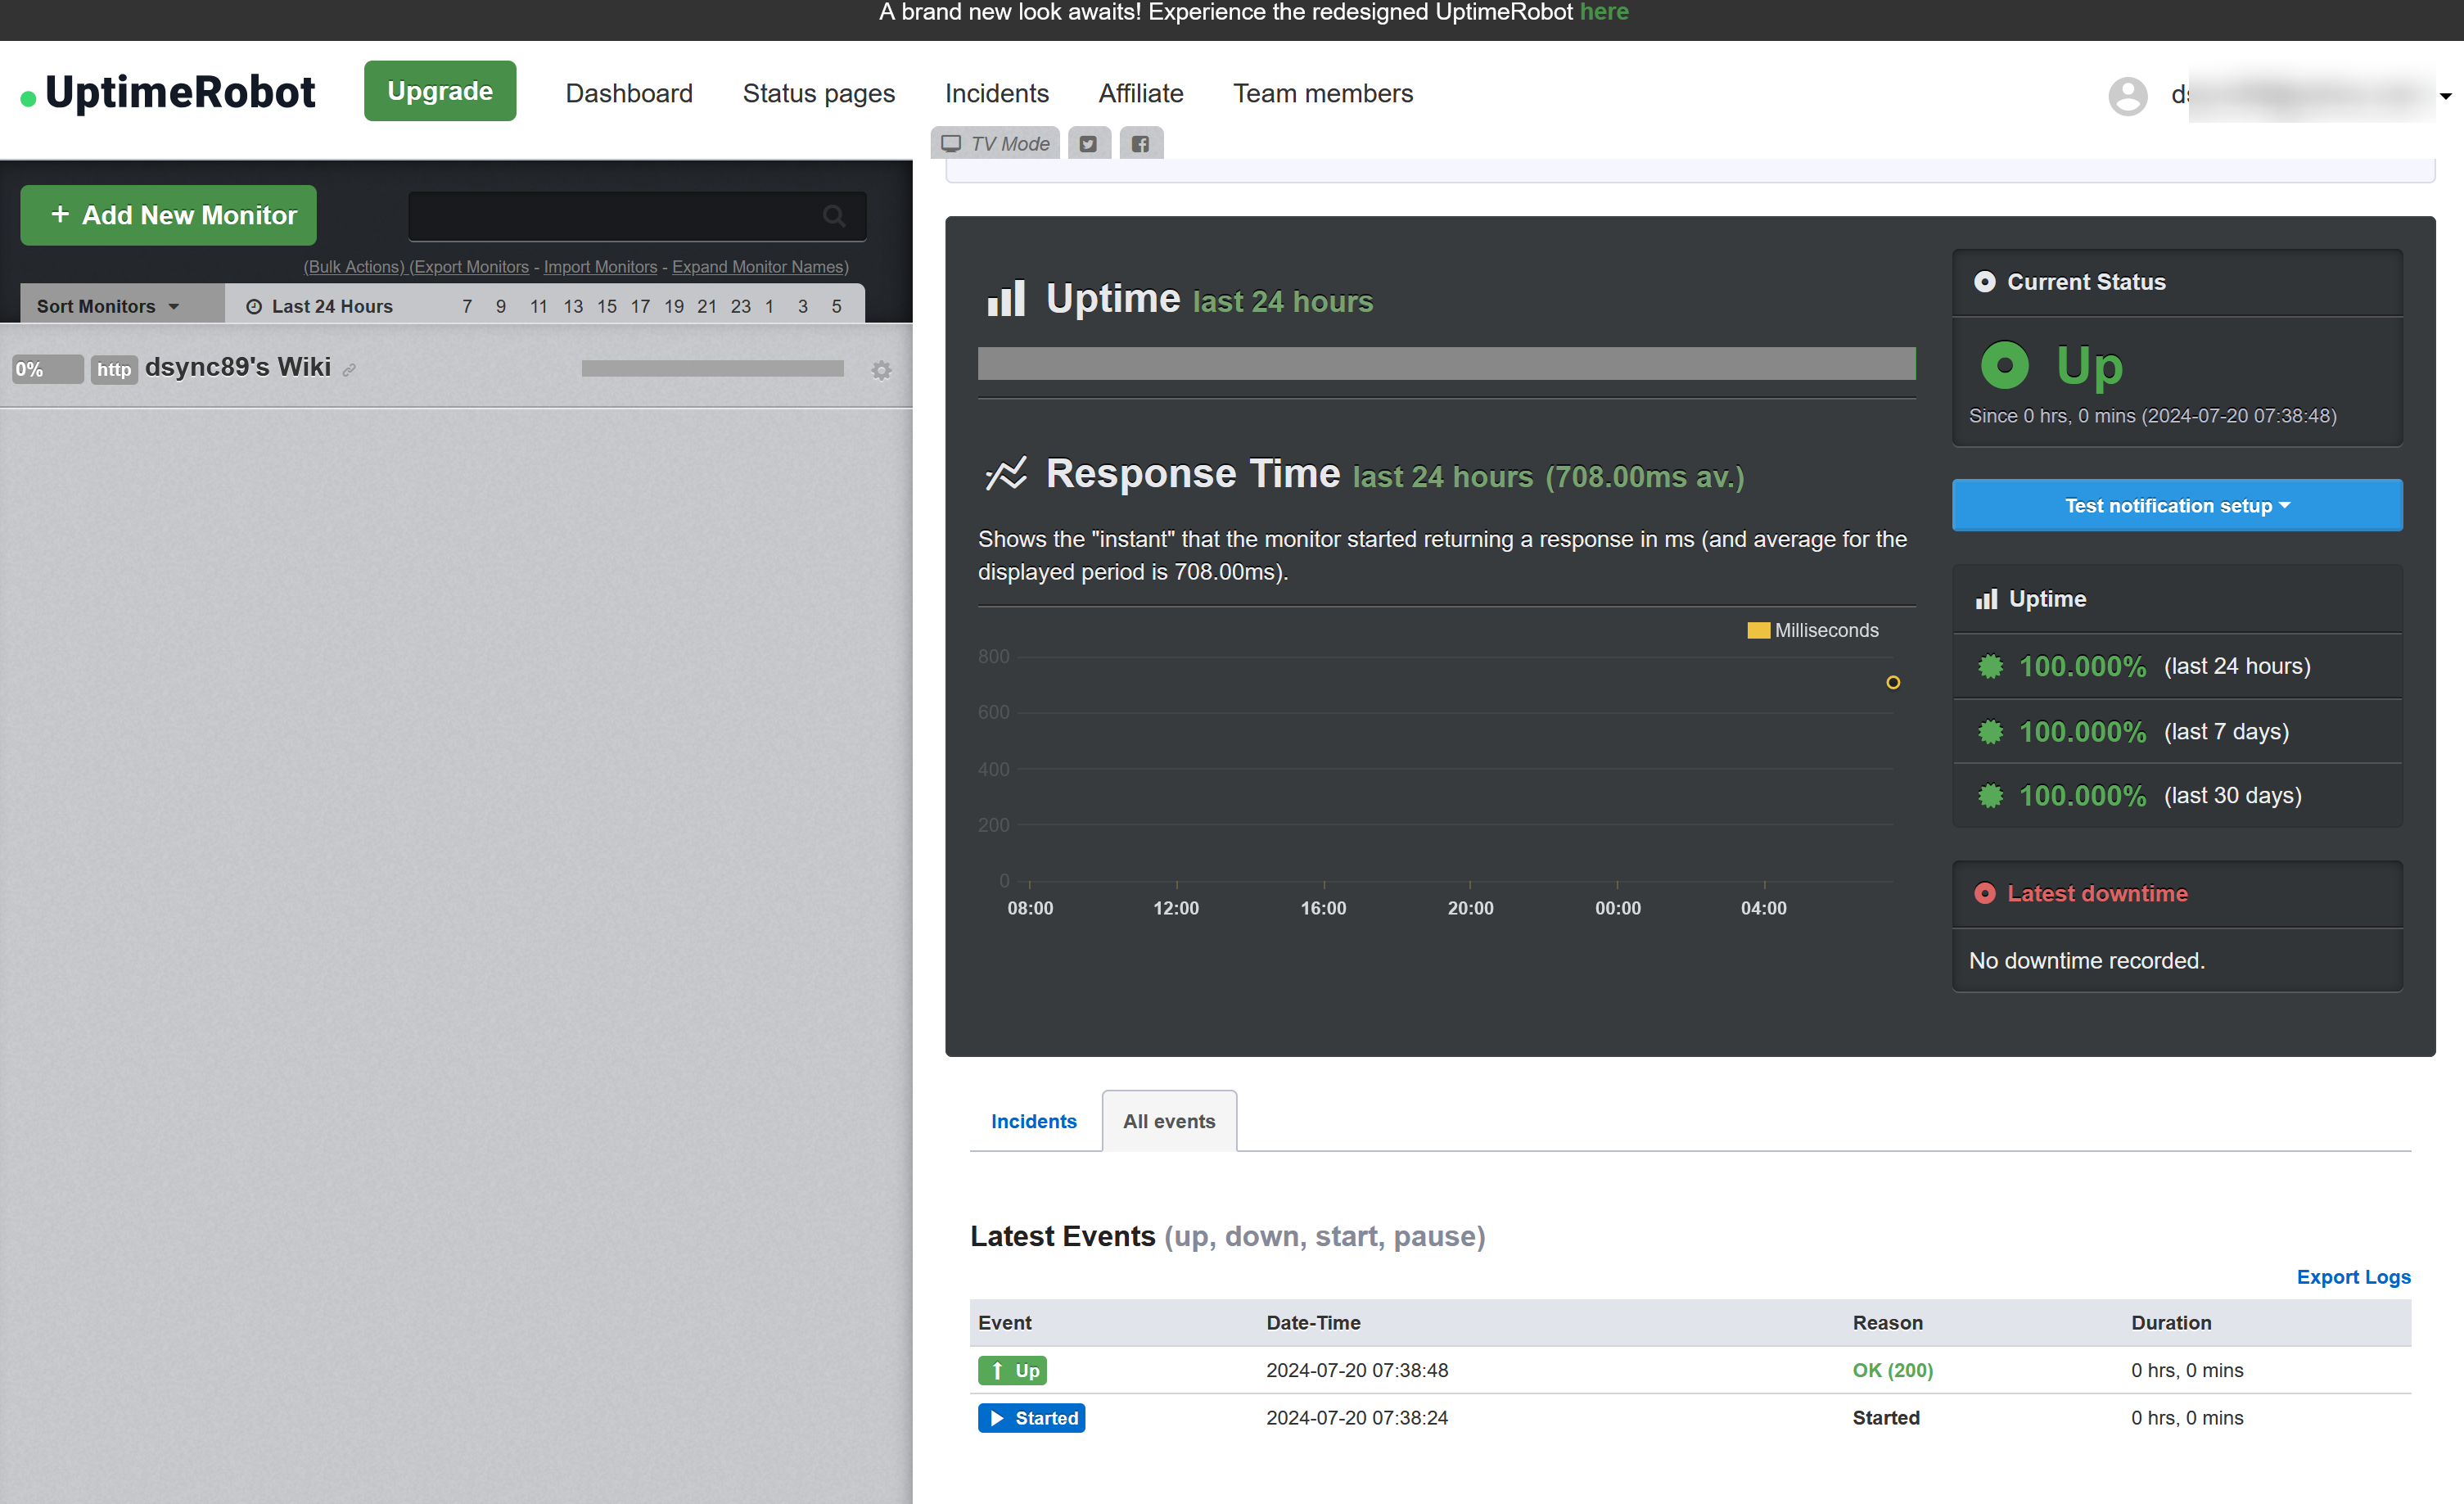
Result.
Comparing with UptimeRobot
UptimeKuma is a self-hosted version of UptimeRobot, many of the fields in the UI pretty similar and straightforward to use.
After adding.
Setup Notification
Discord
Create a channel in Discord.
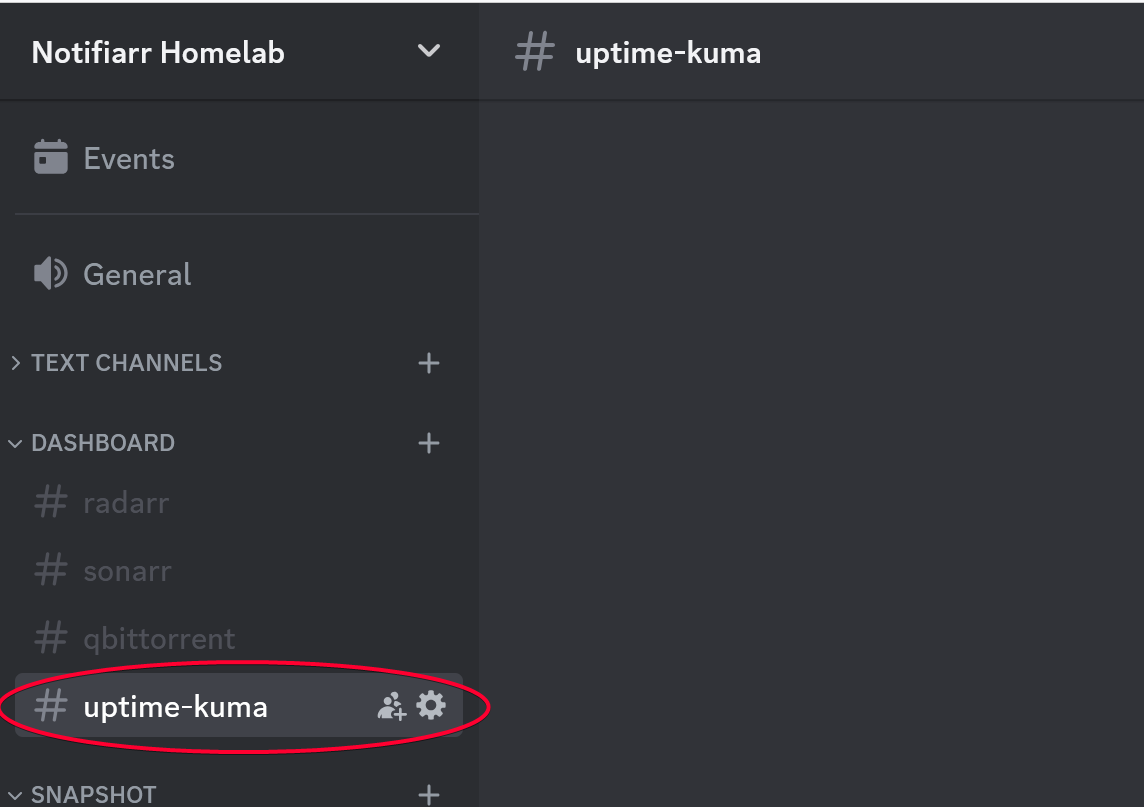
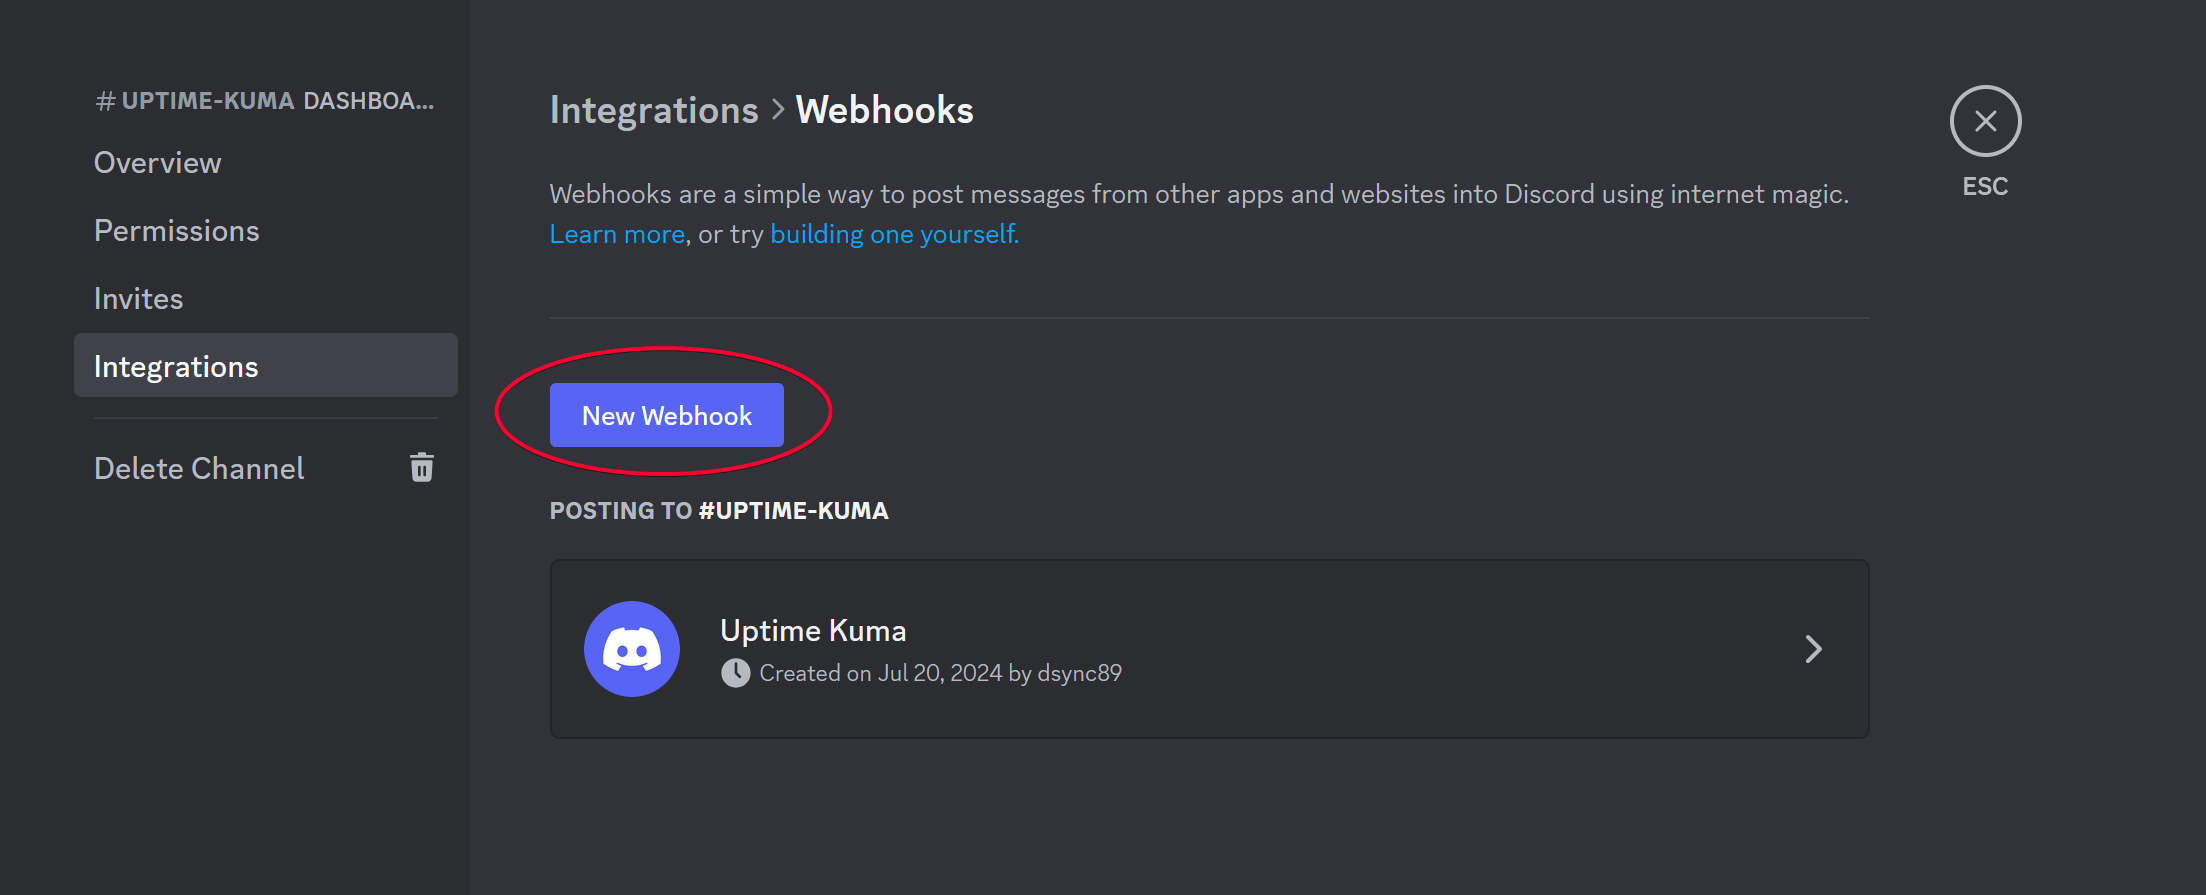
Click the cogwheel icon on the channel, then select Integrations > Webhooks
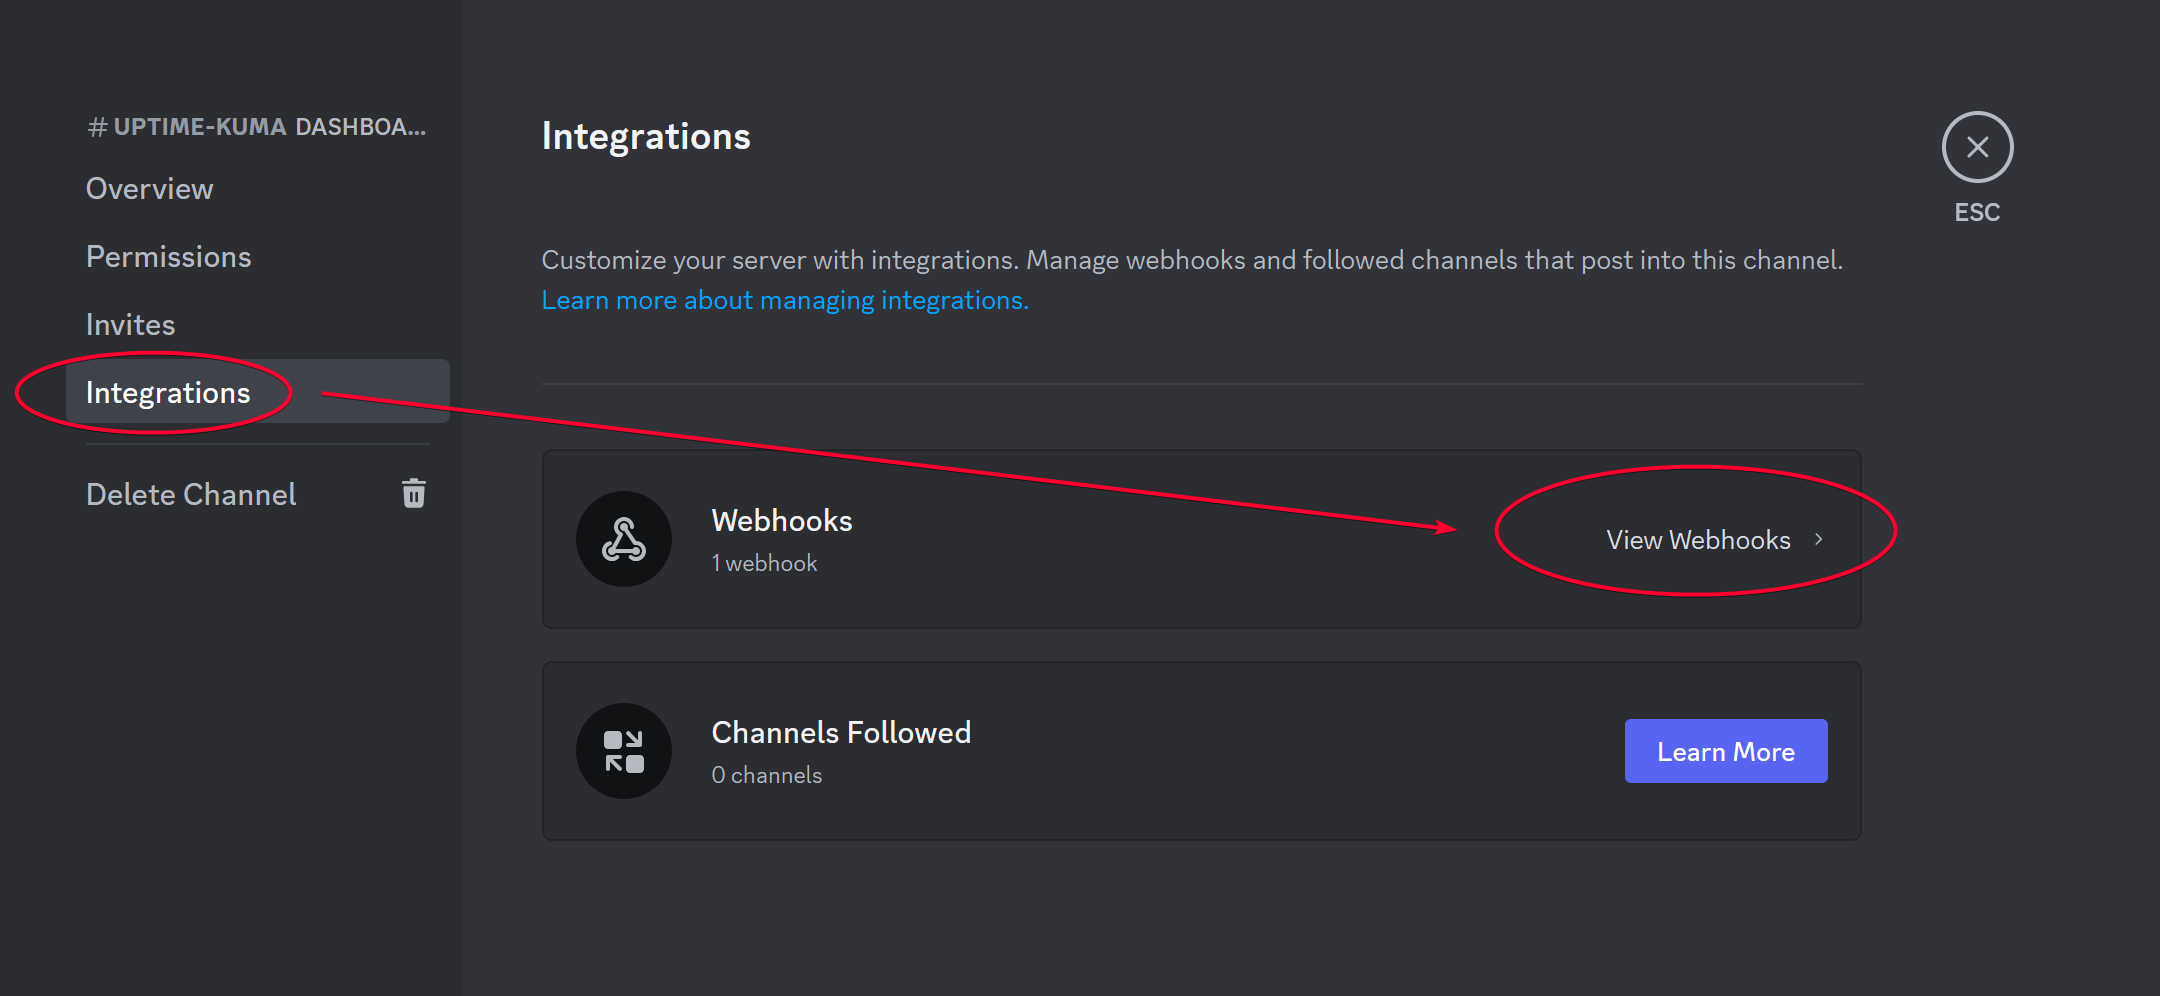
Click New Webhook button
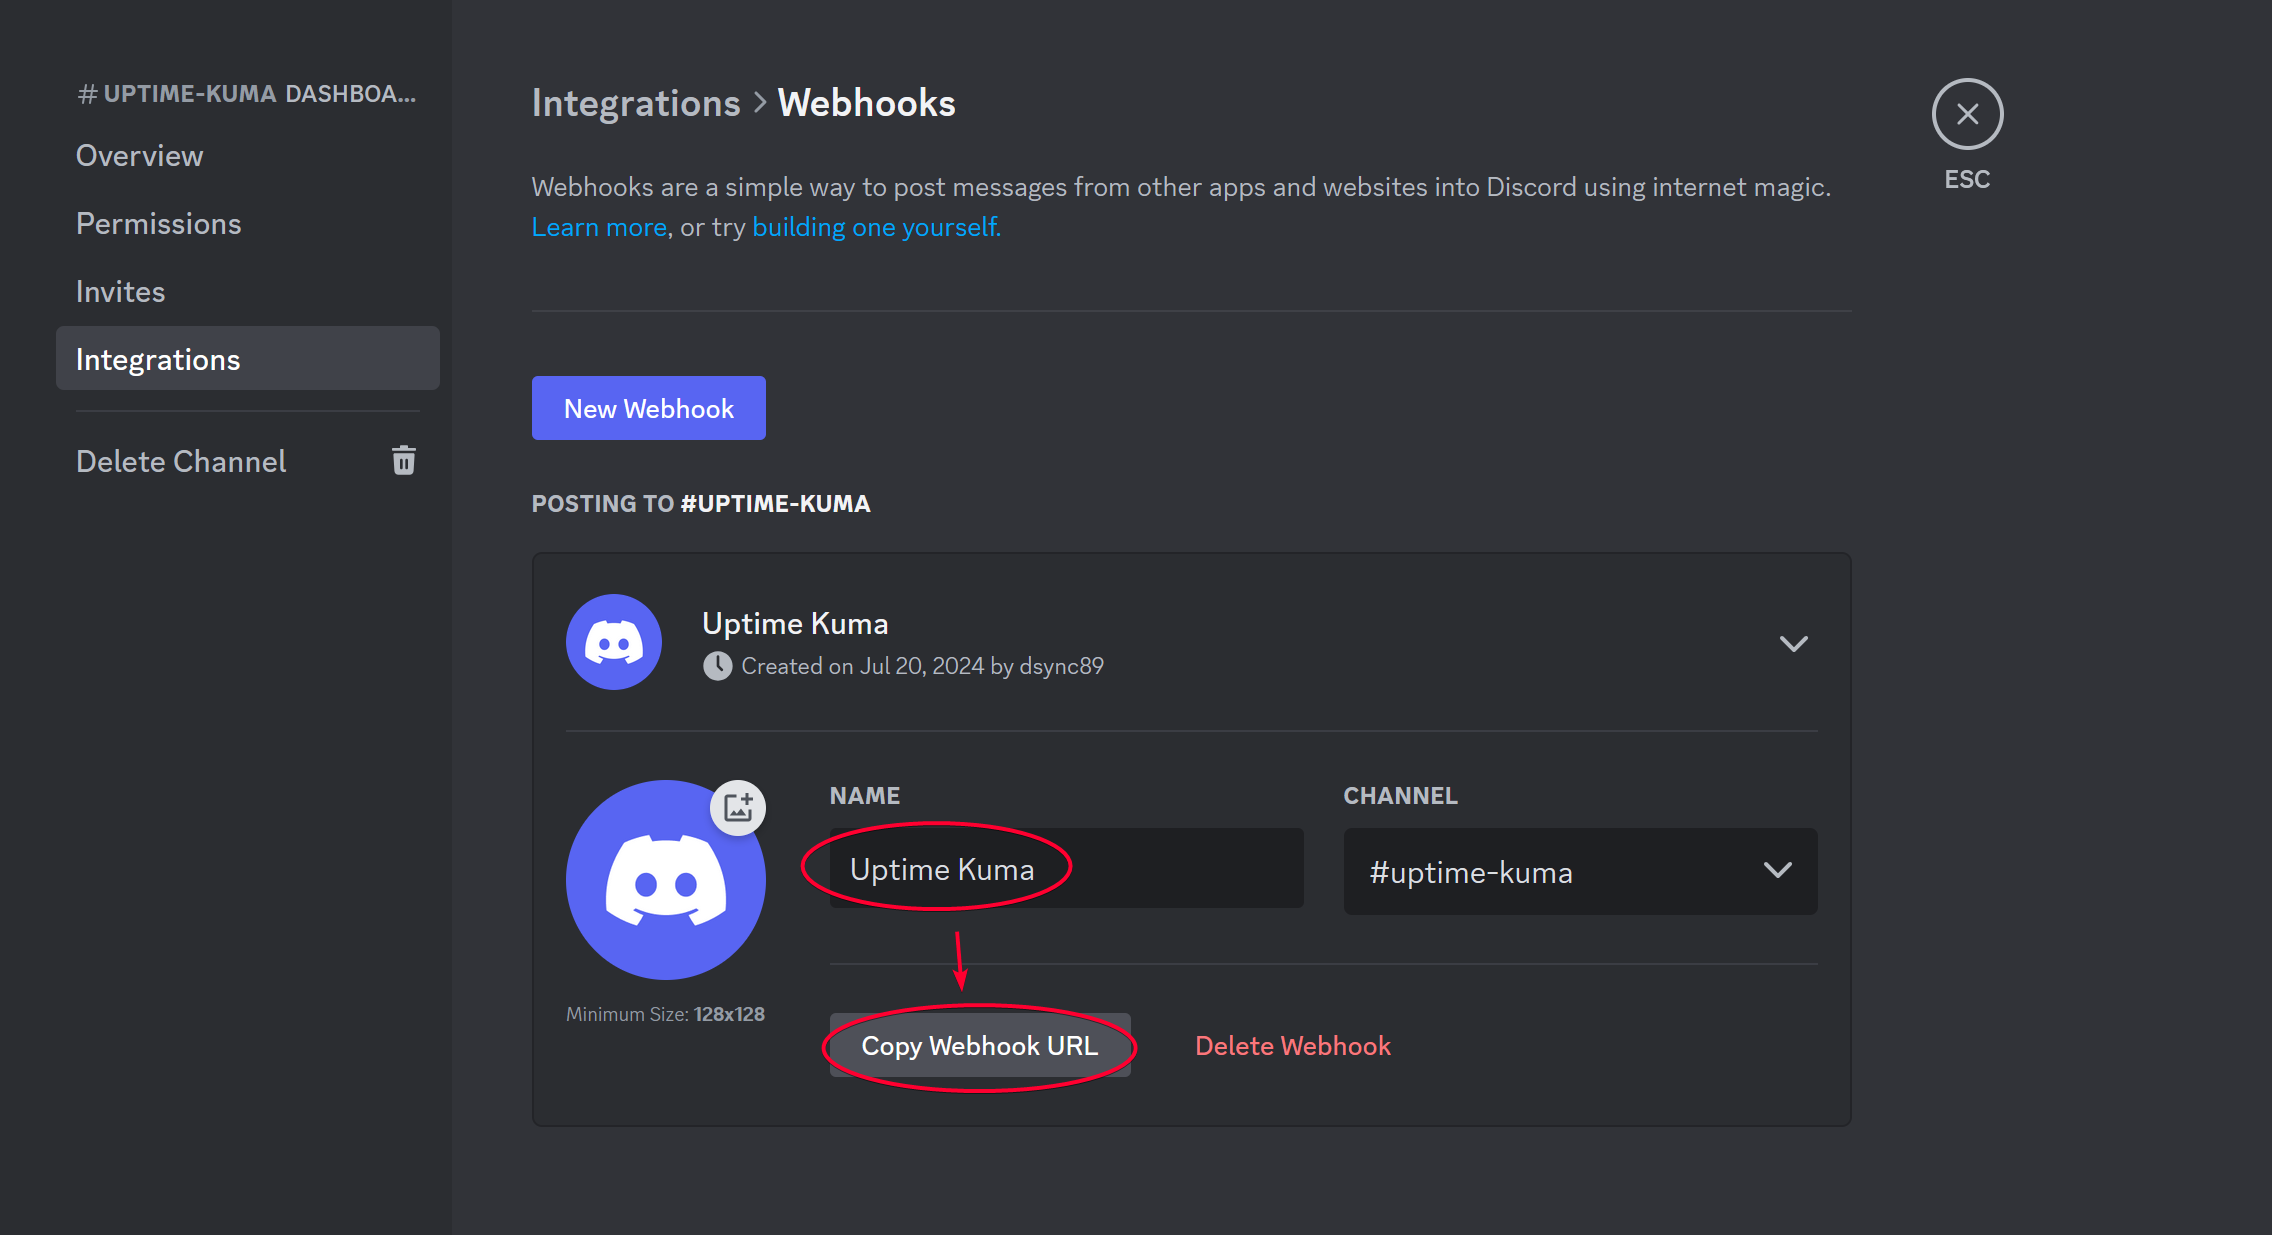
Modify the bot name to Uptime Kuma for friendly name, then click Copy Webhook URL
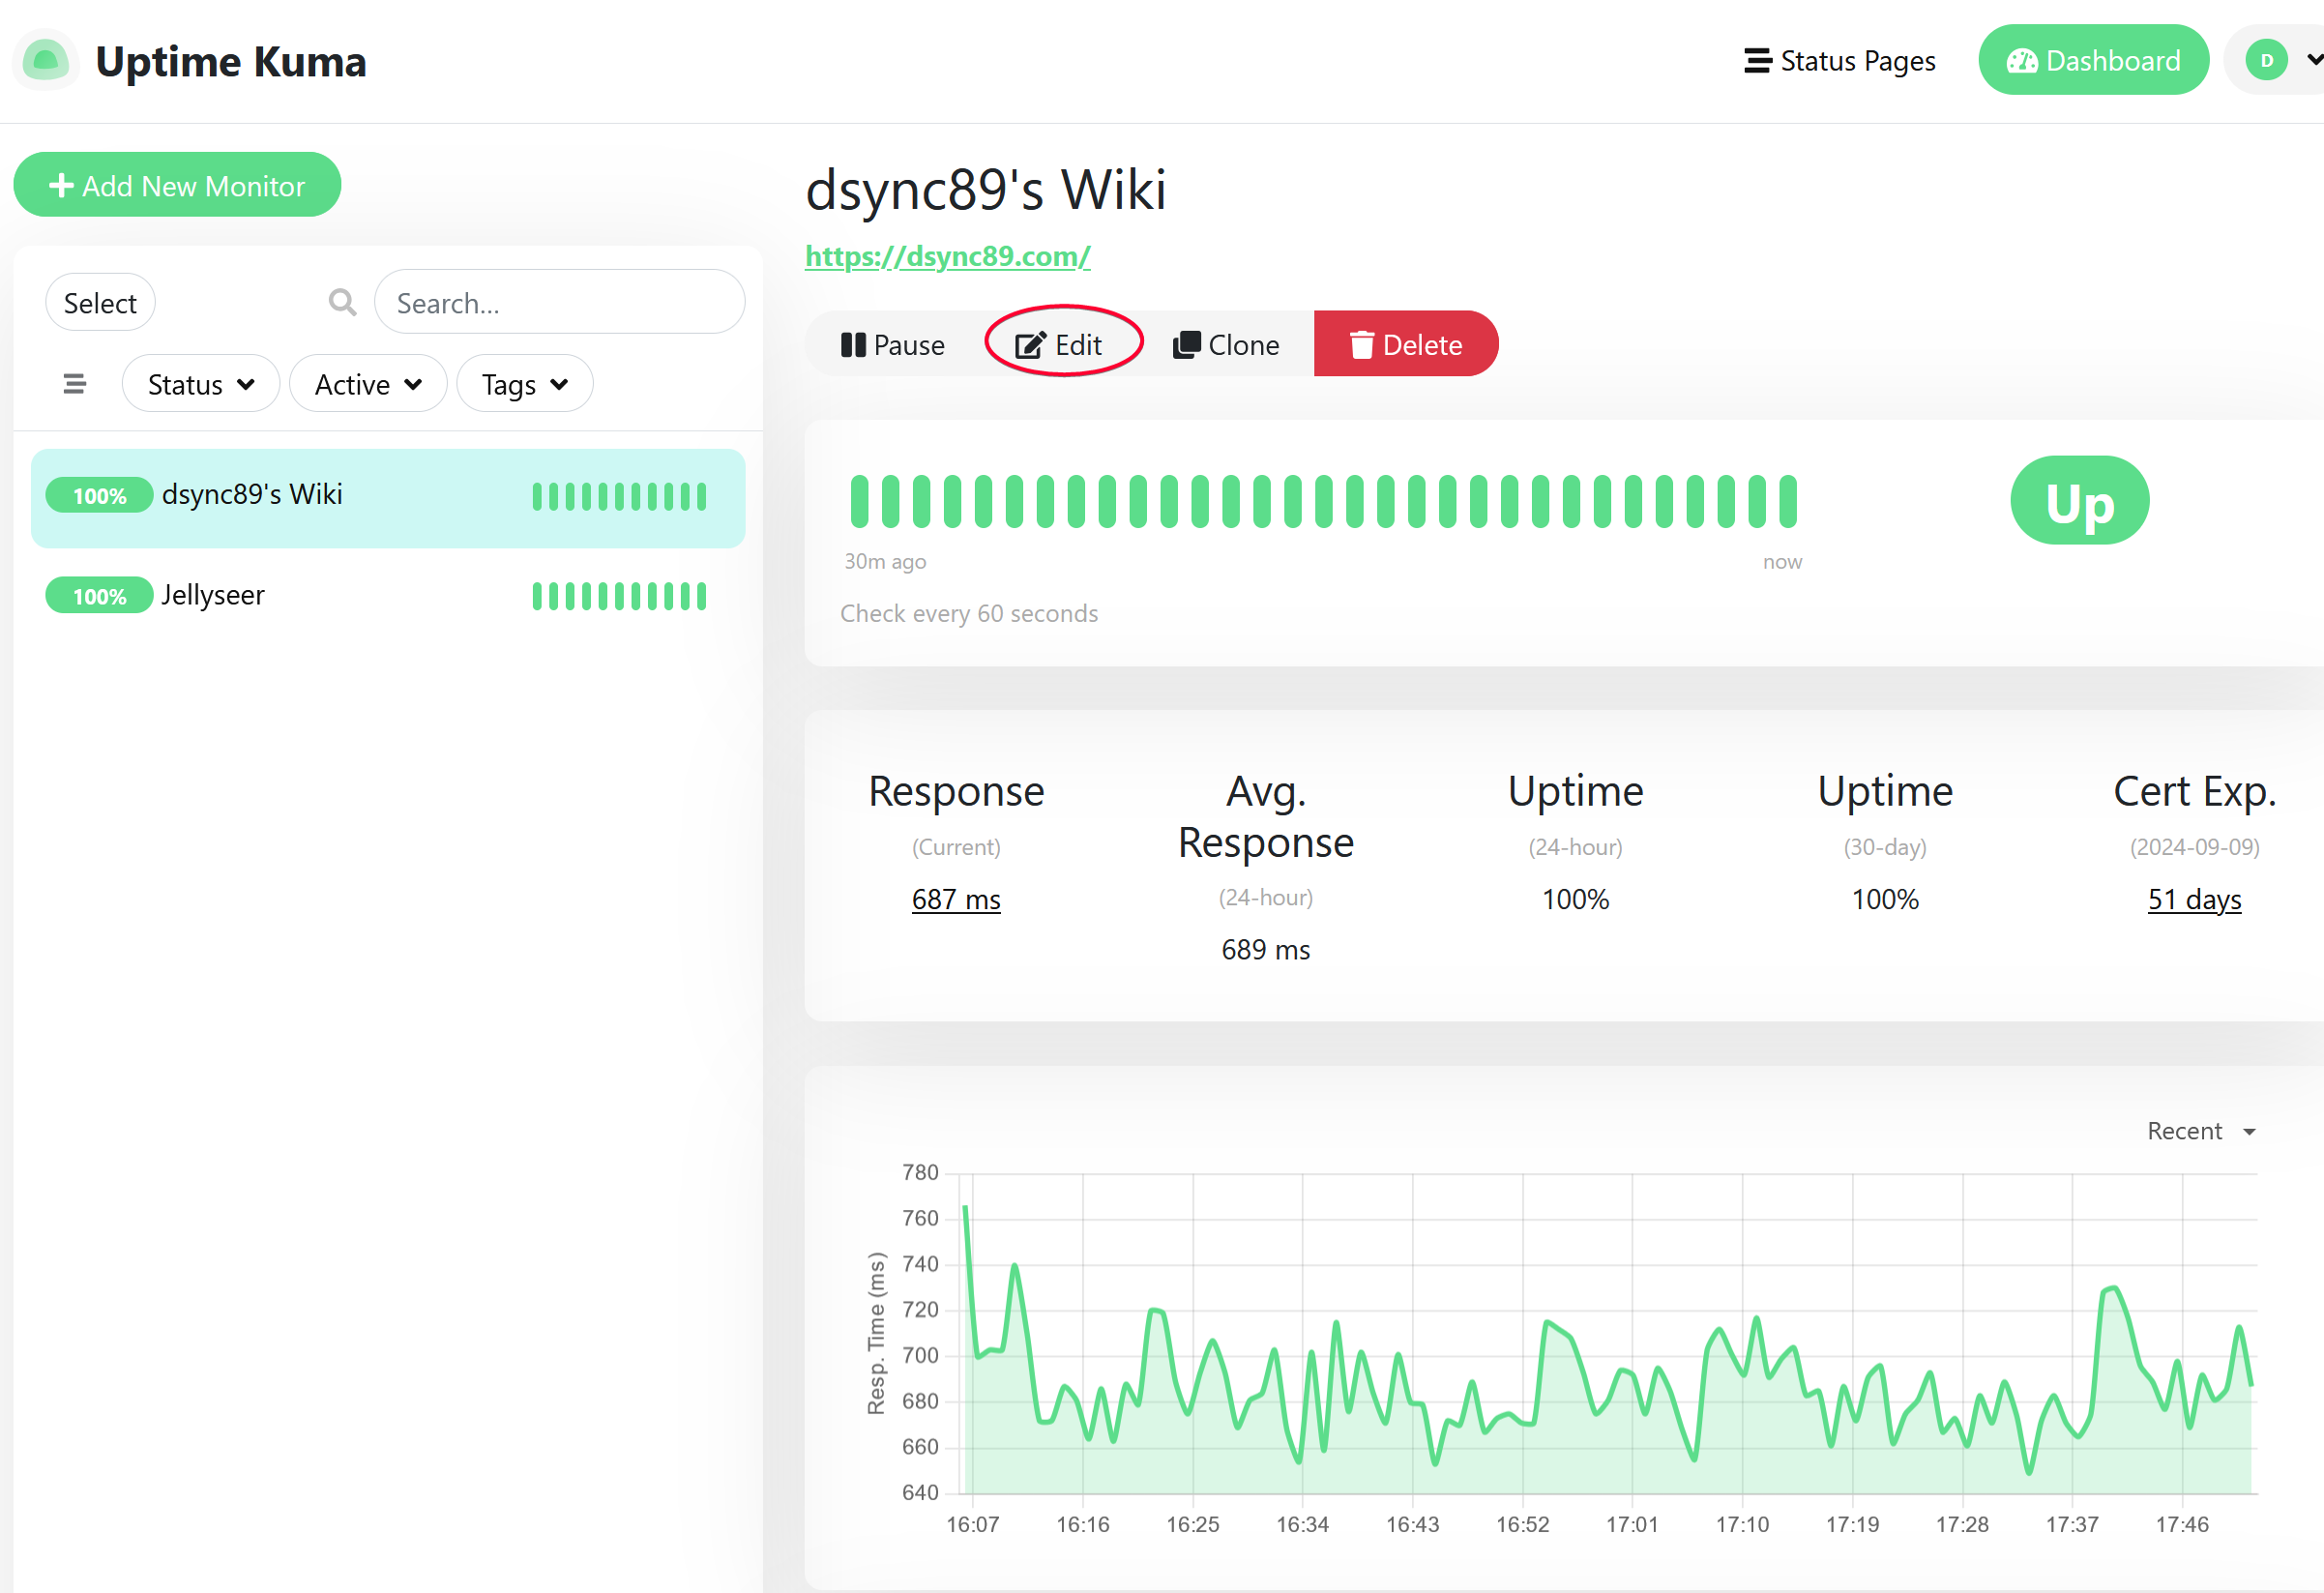
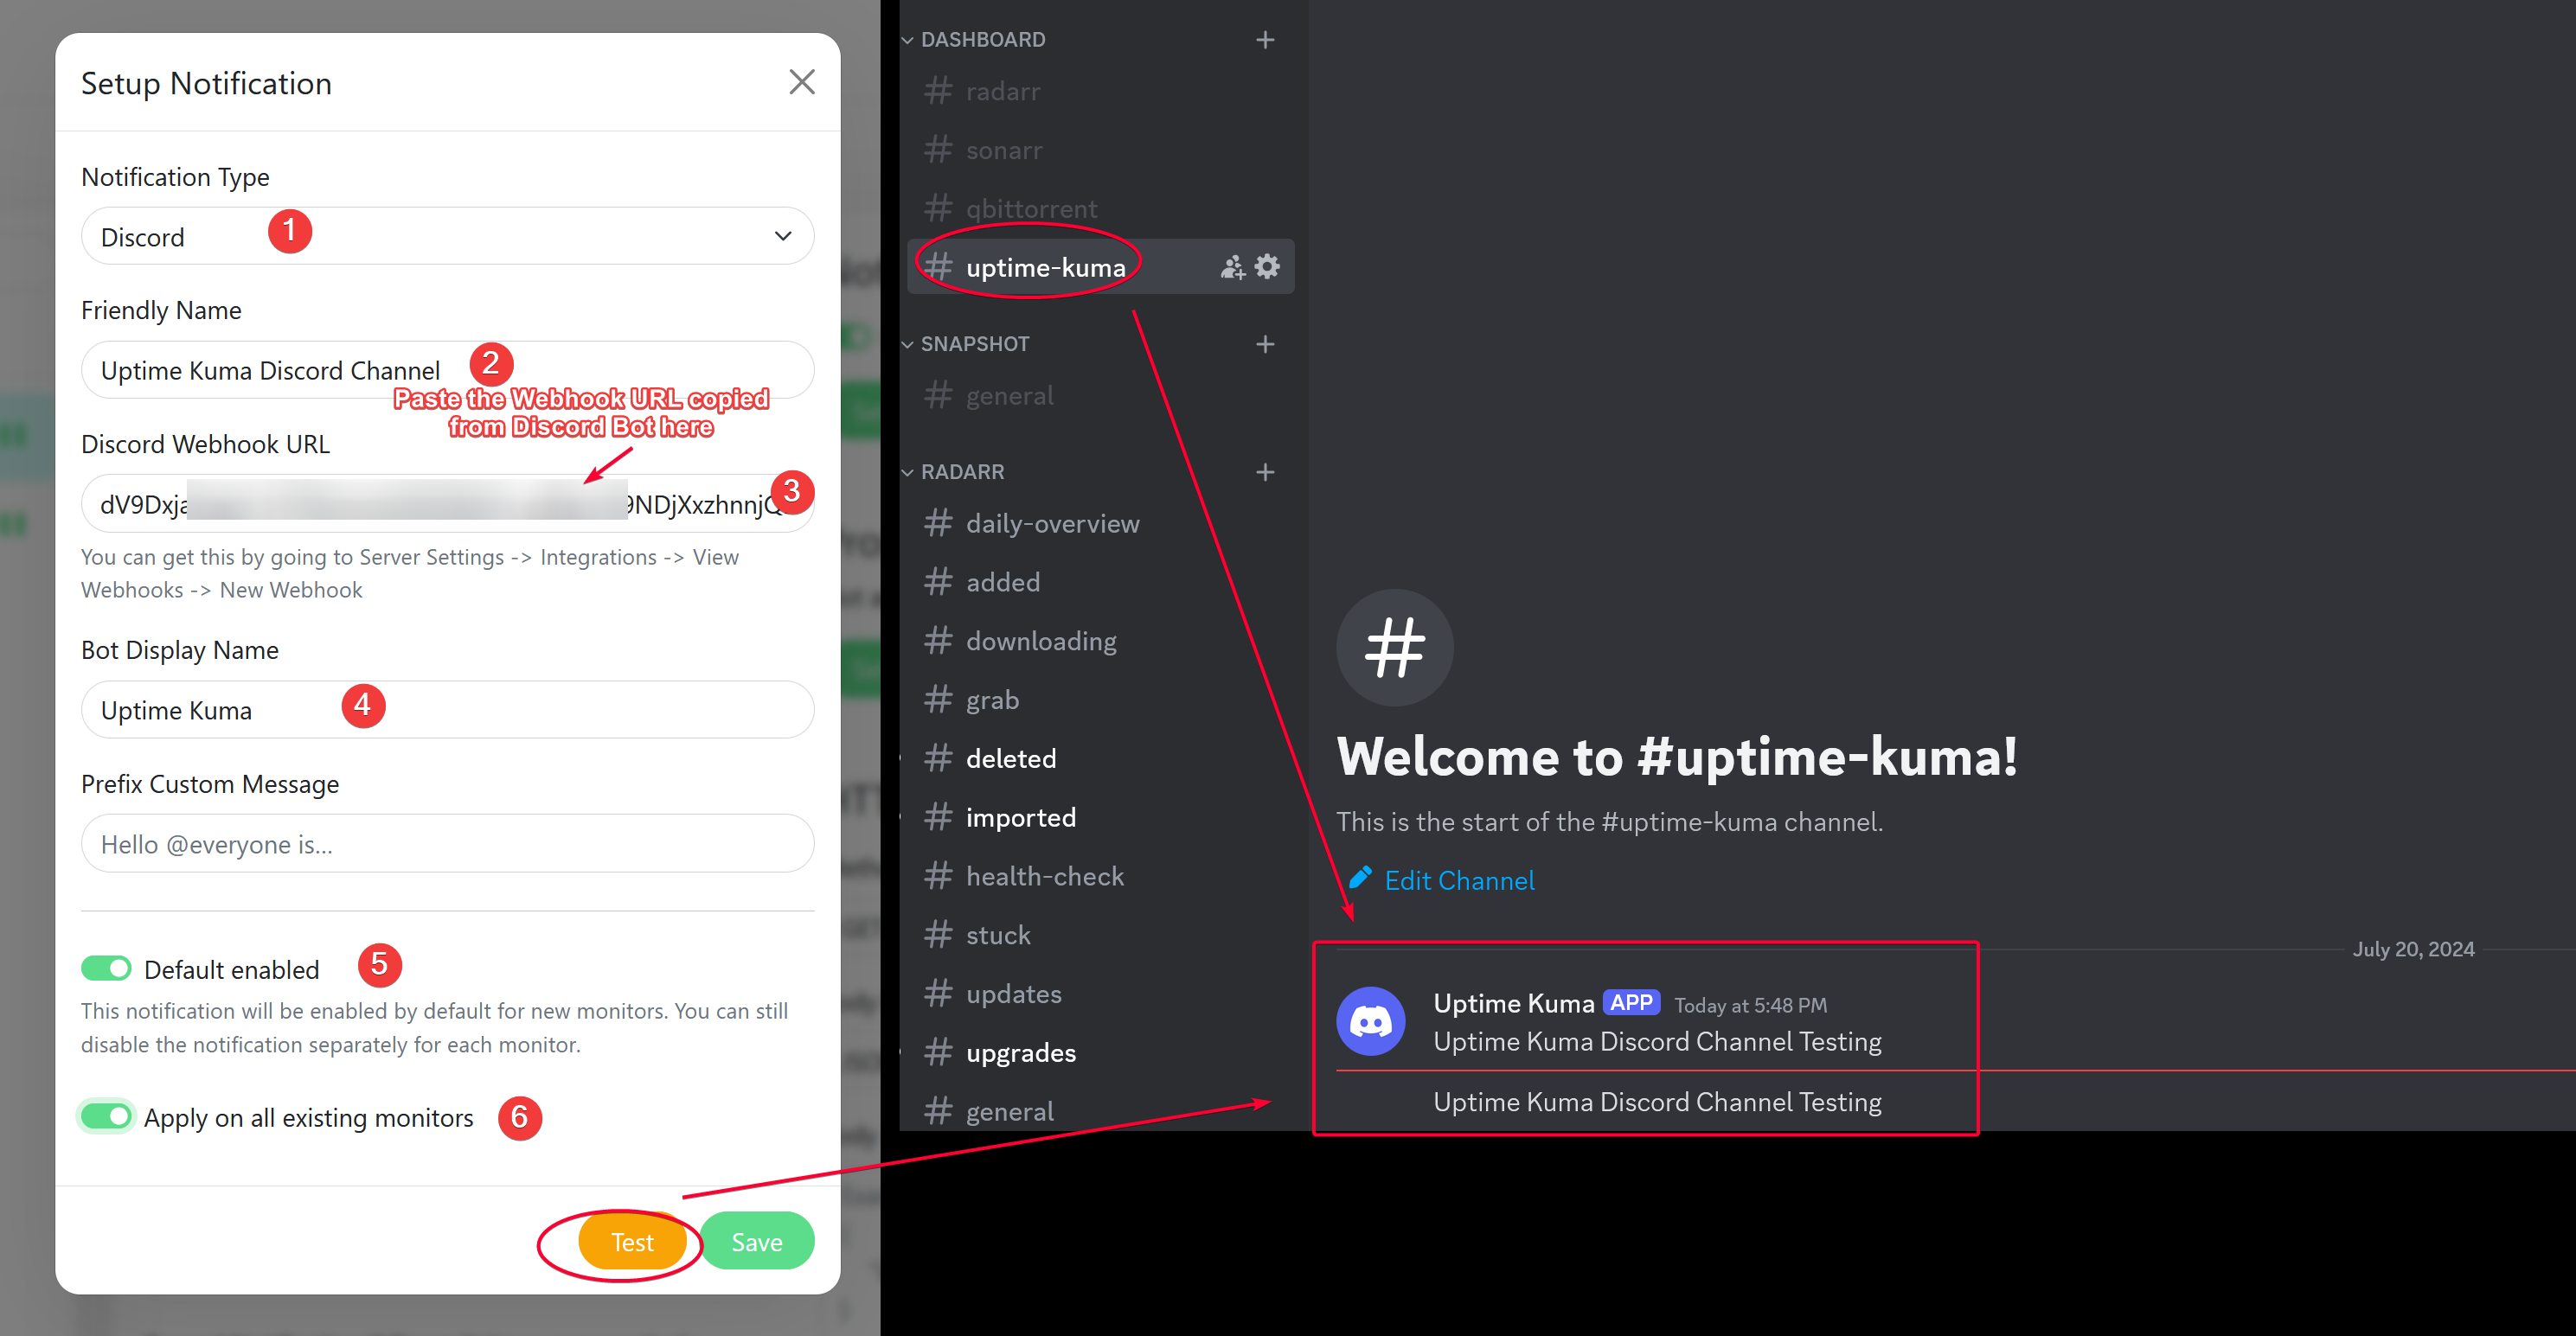
Open Uptime Kuma web UI, then click the Edit button of the service.
Click Setup Notification.
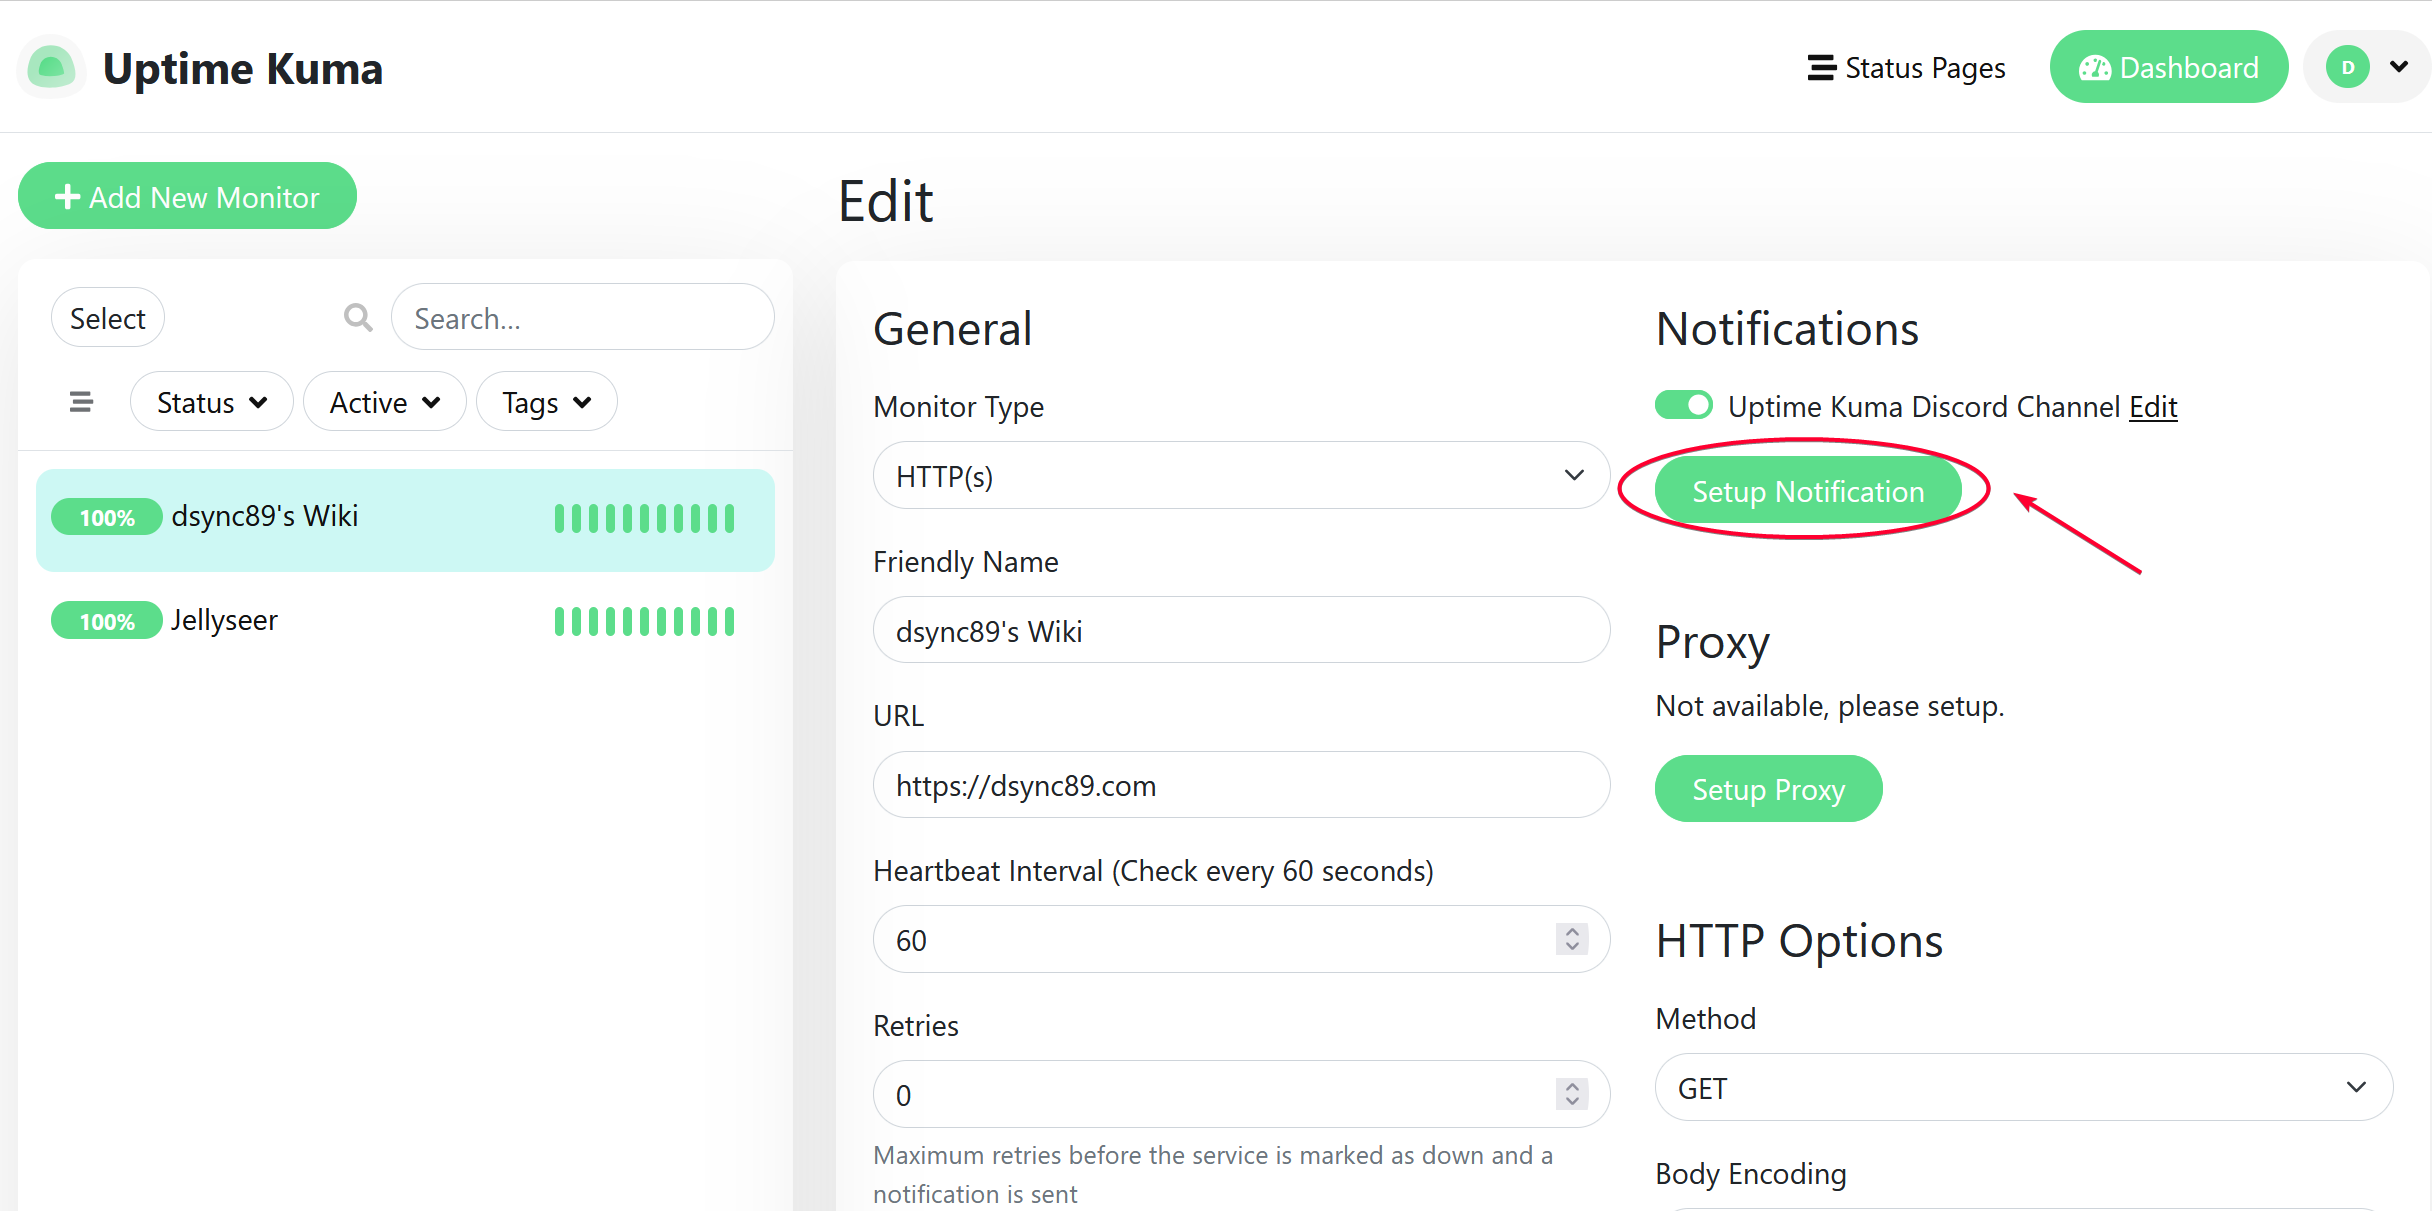
Setup the numbered fields as below.
Click the Test button and you should see a message sent to Discord channel #uptime-kuma
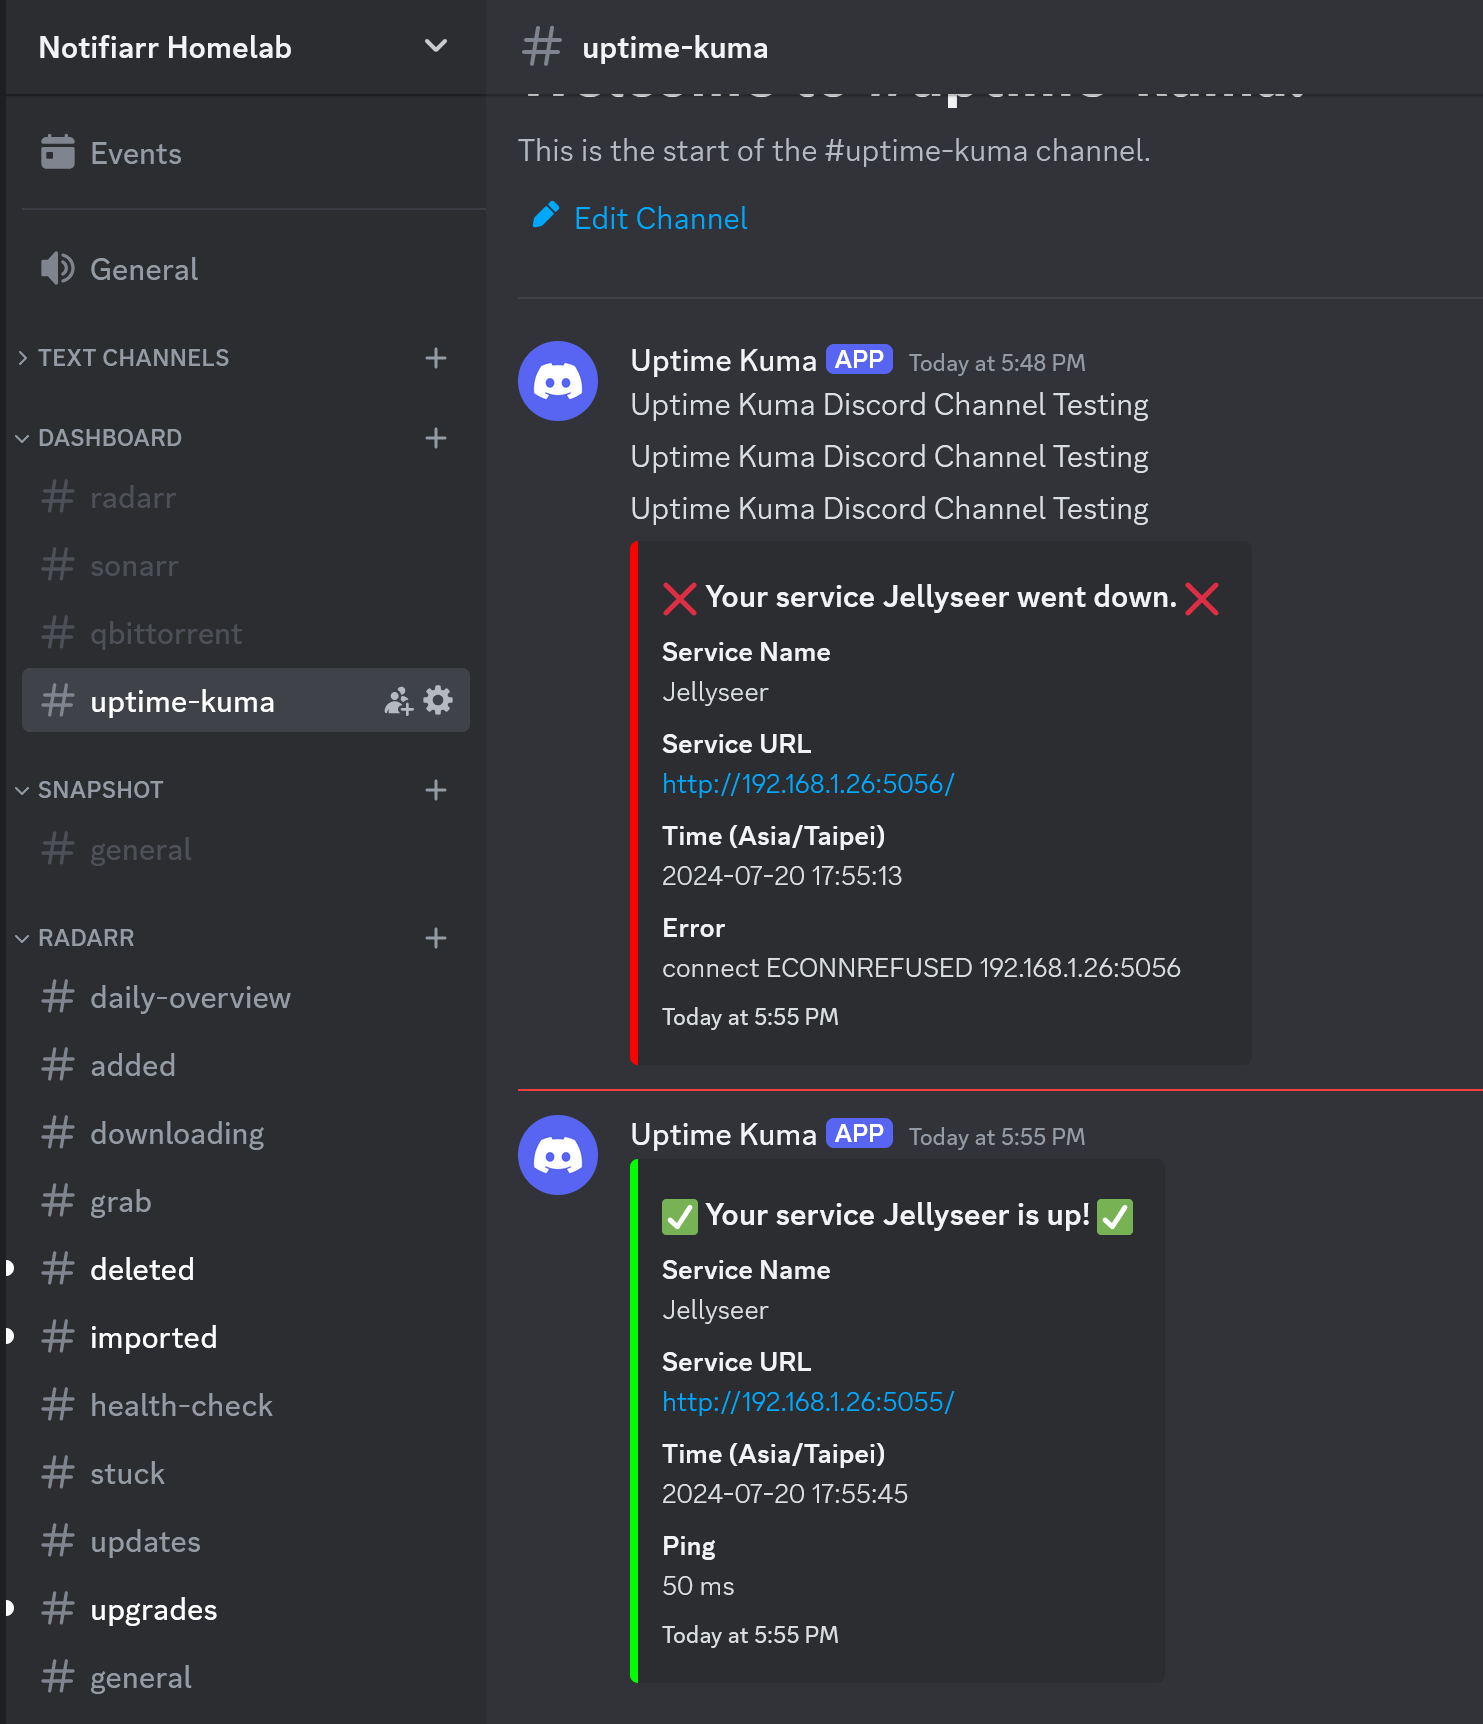
Congratulations. A notification will now be sent to Discord channel if that service is down.
Example of notification sent if that service is unreachable and up again.
Optional
Creating Monitor Groups (Optional)
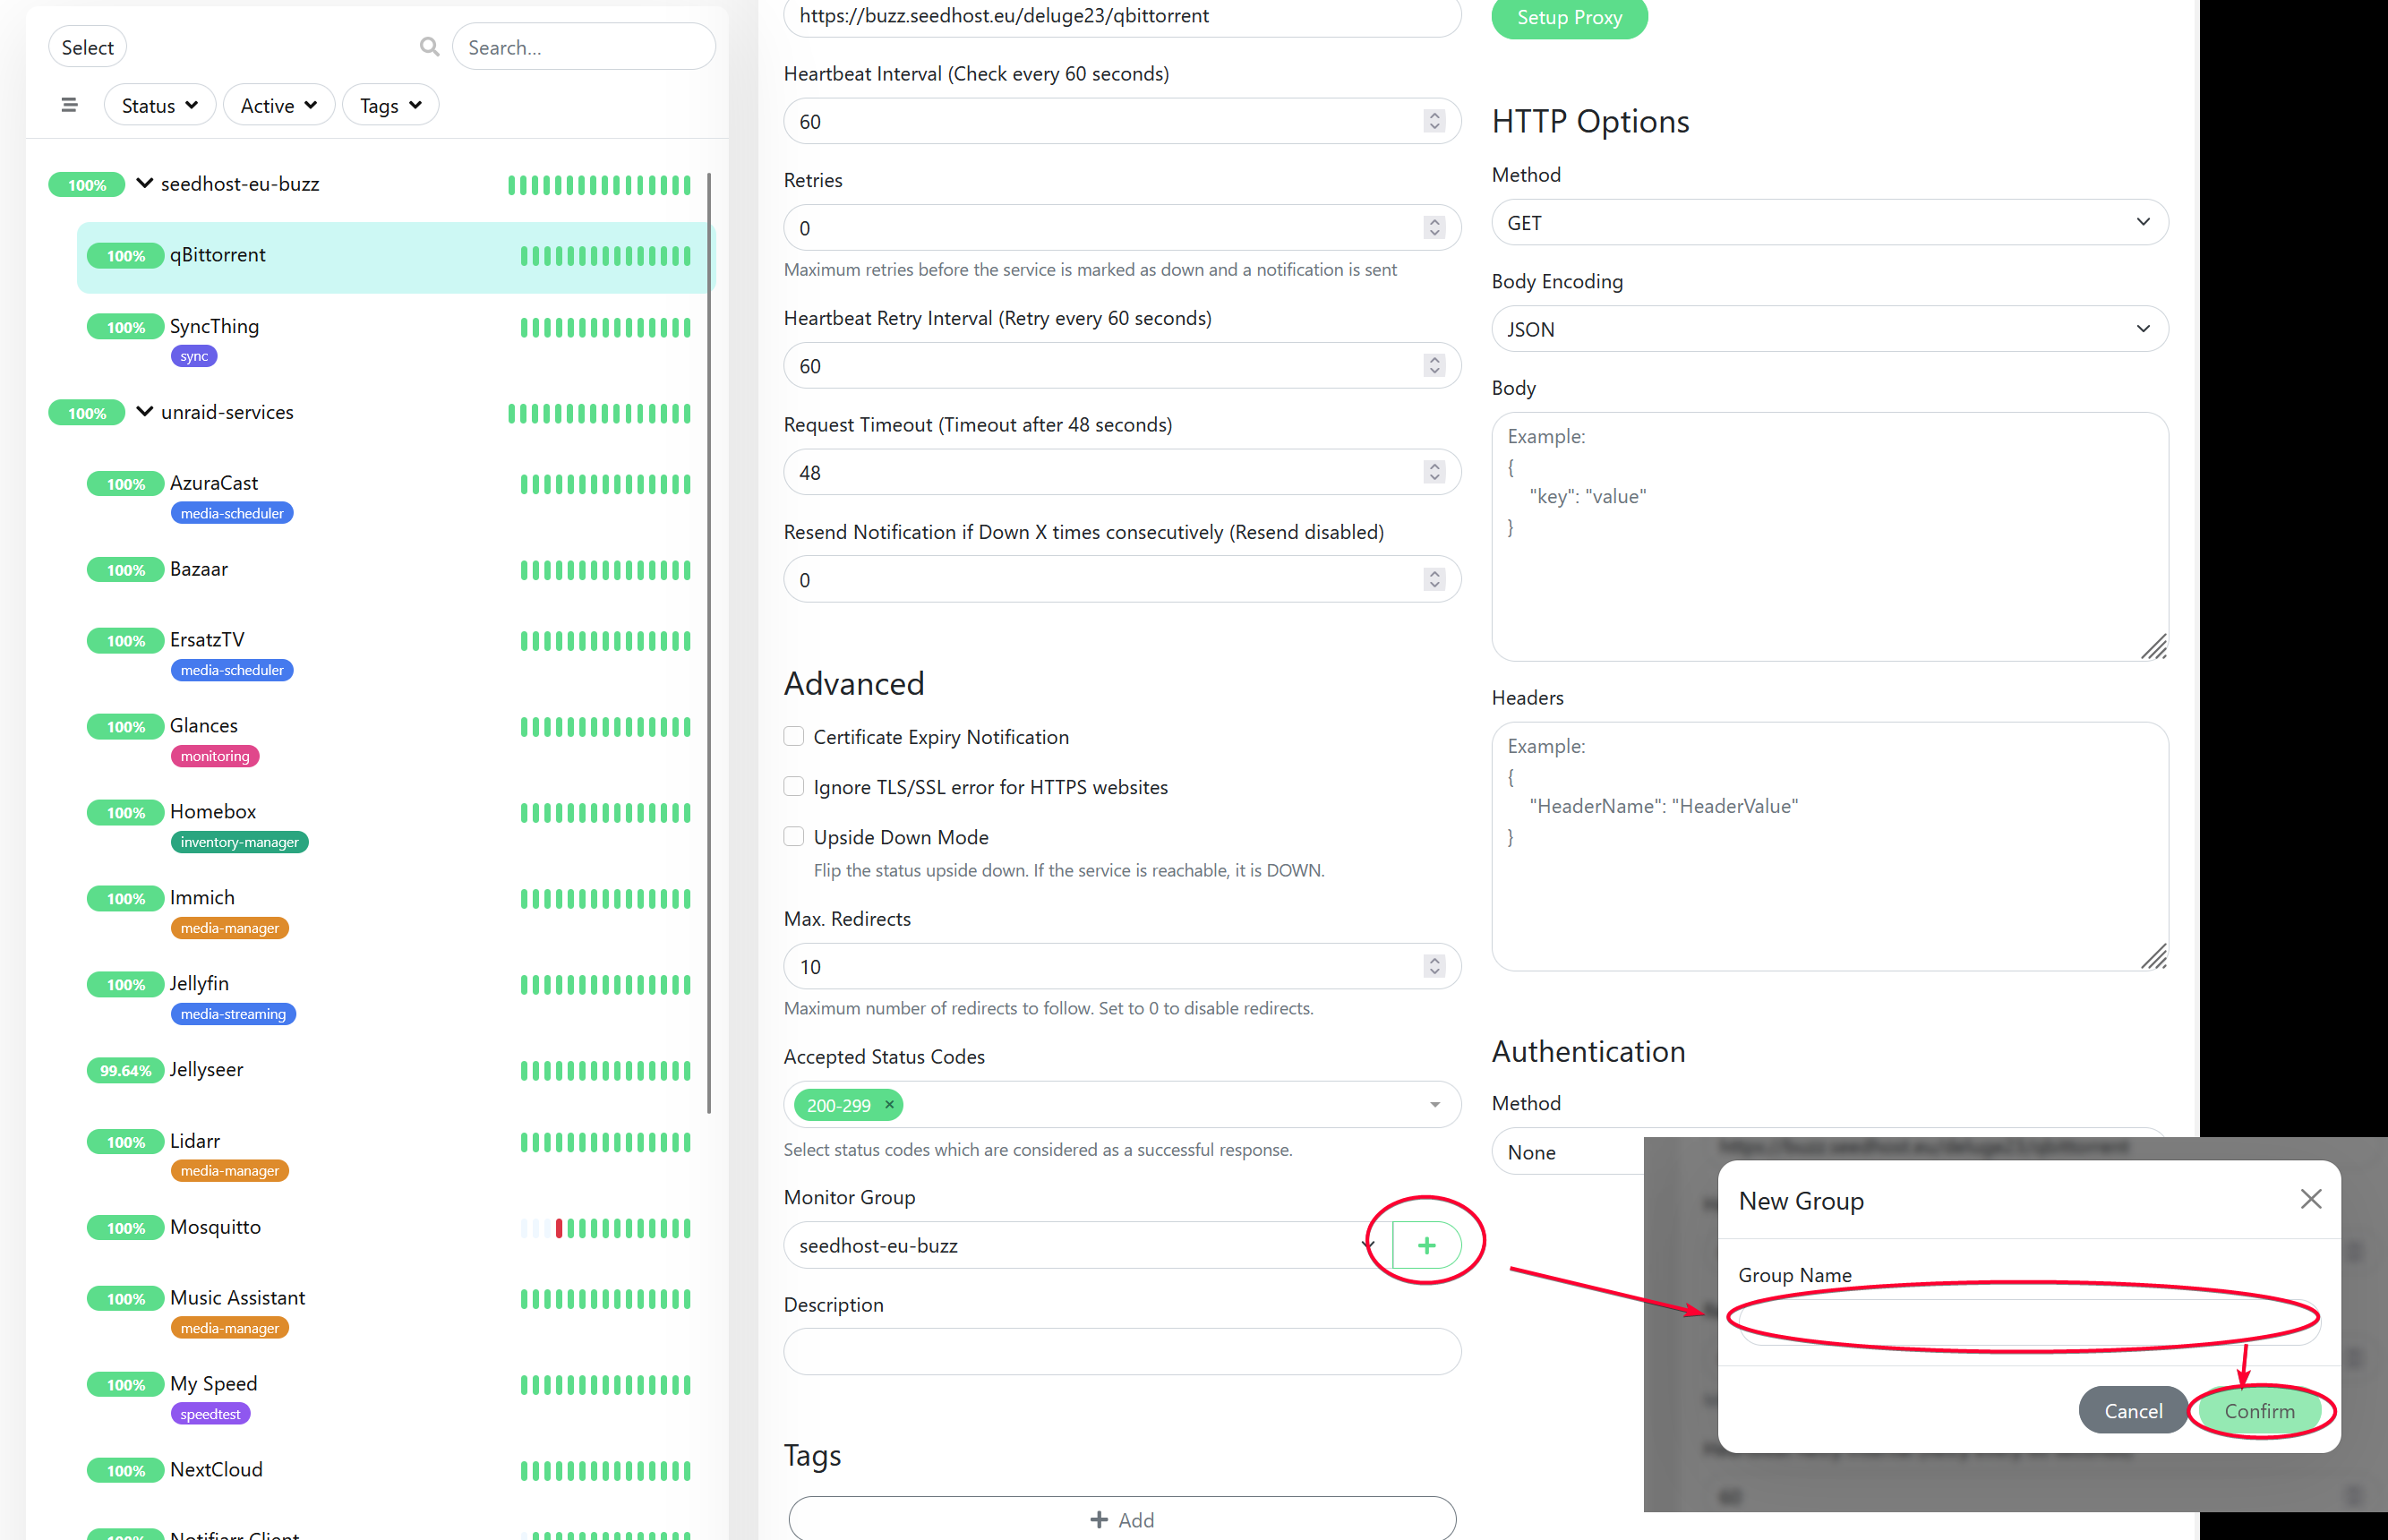
If you have a lot of services running on several servers, you can create a Monitor Group to better display them.
To create a Monitor Group for a Service, simply Edit a service and scroll to the bottom to find Monitor Group section.
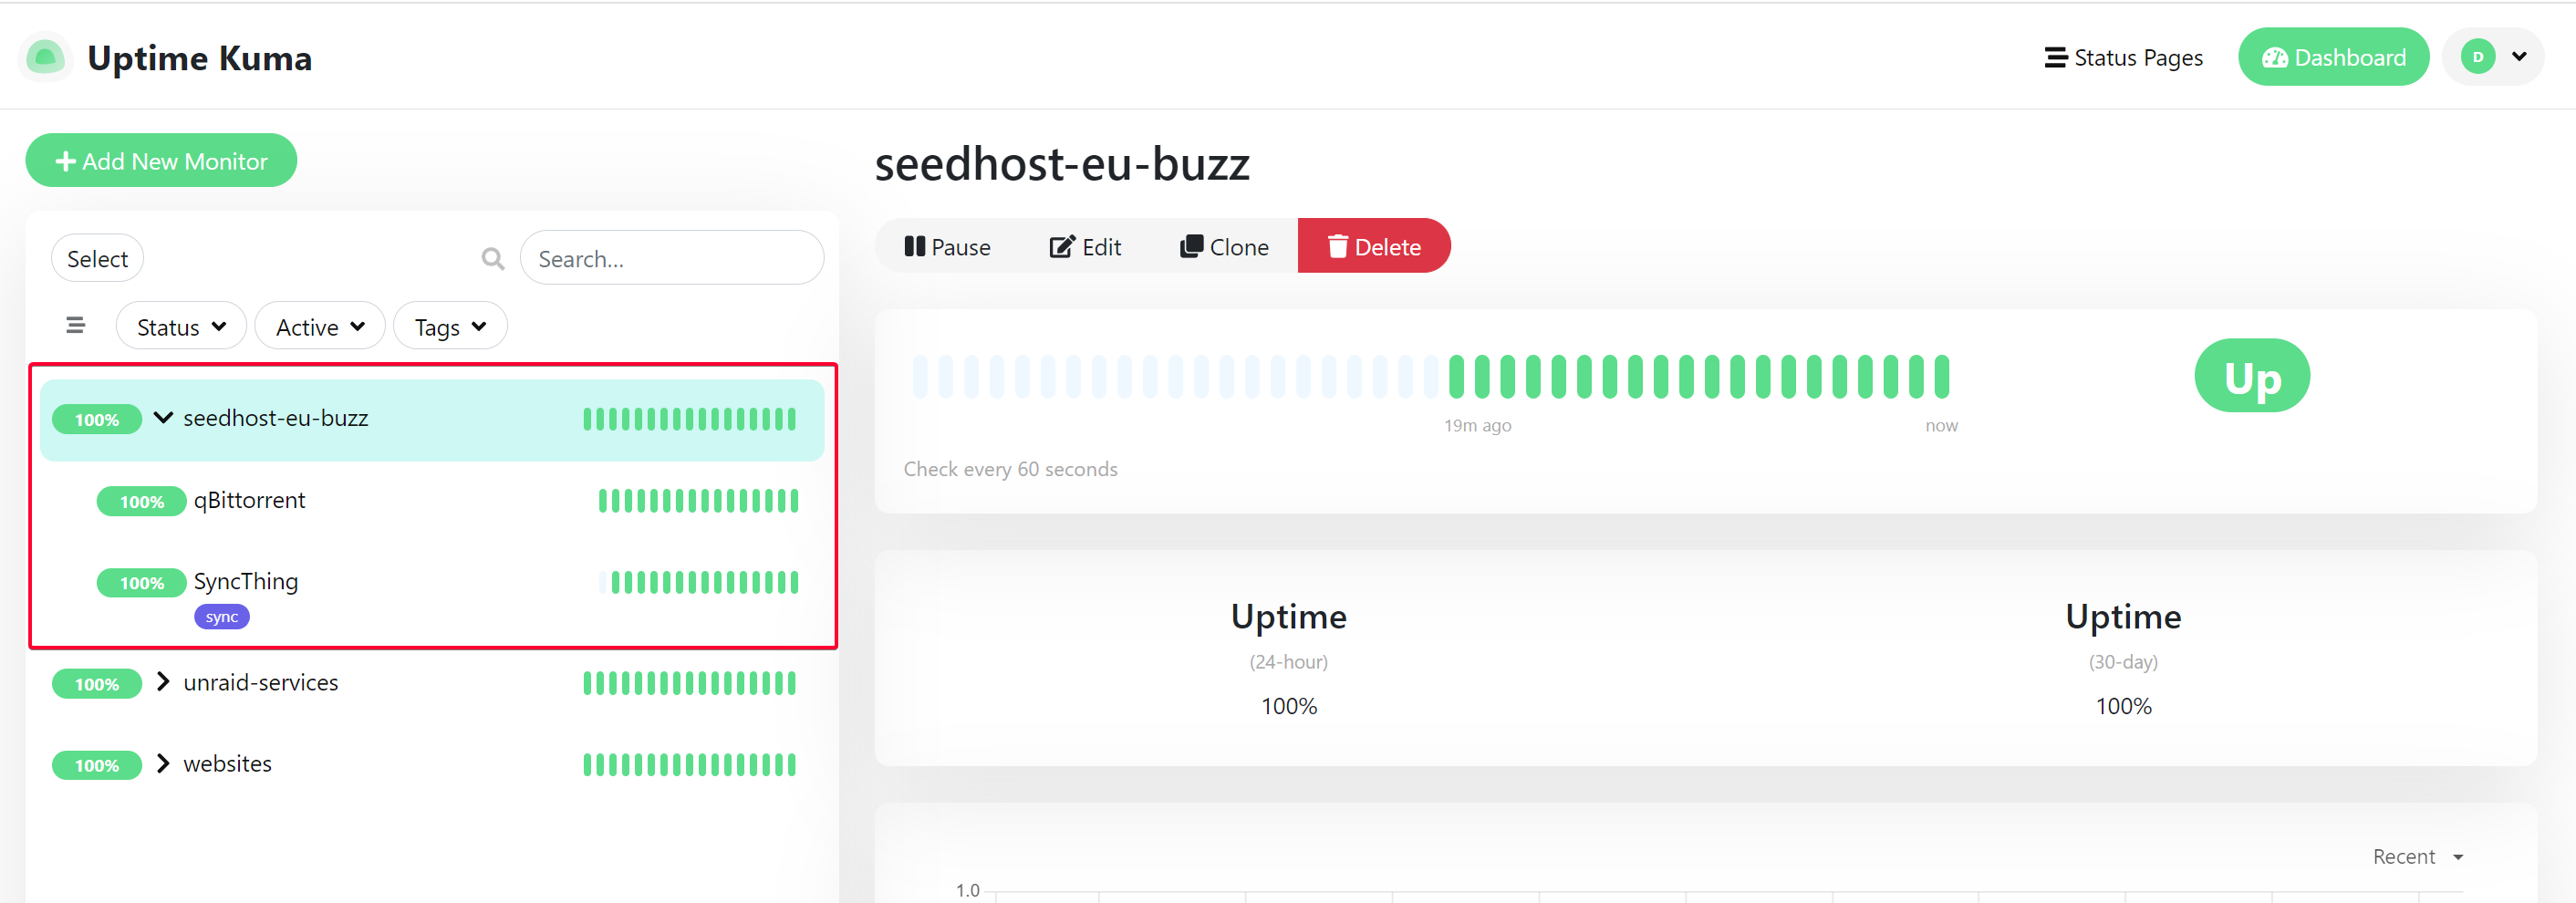
Services running on my seedbox hosted at Seedhost.EU.
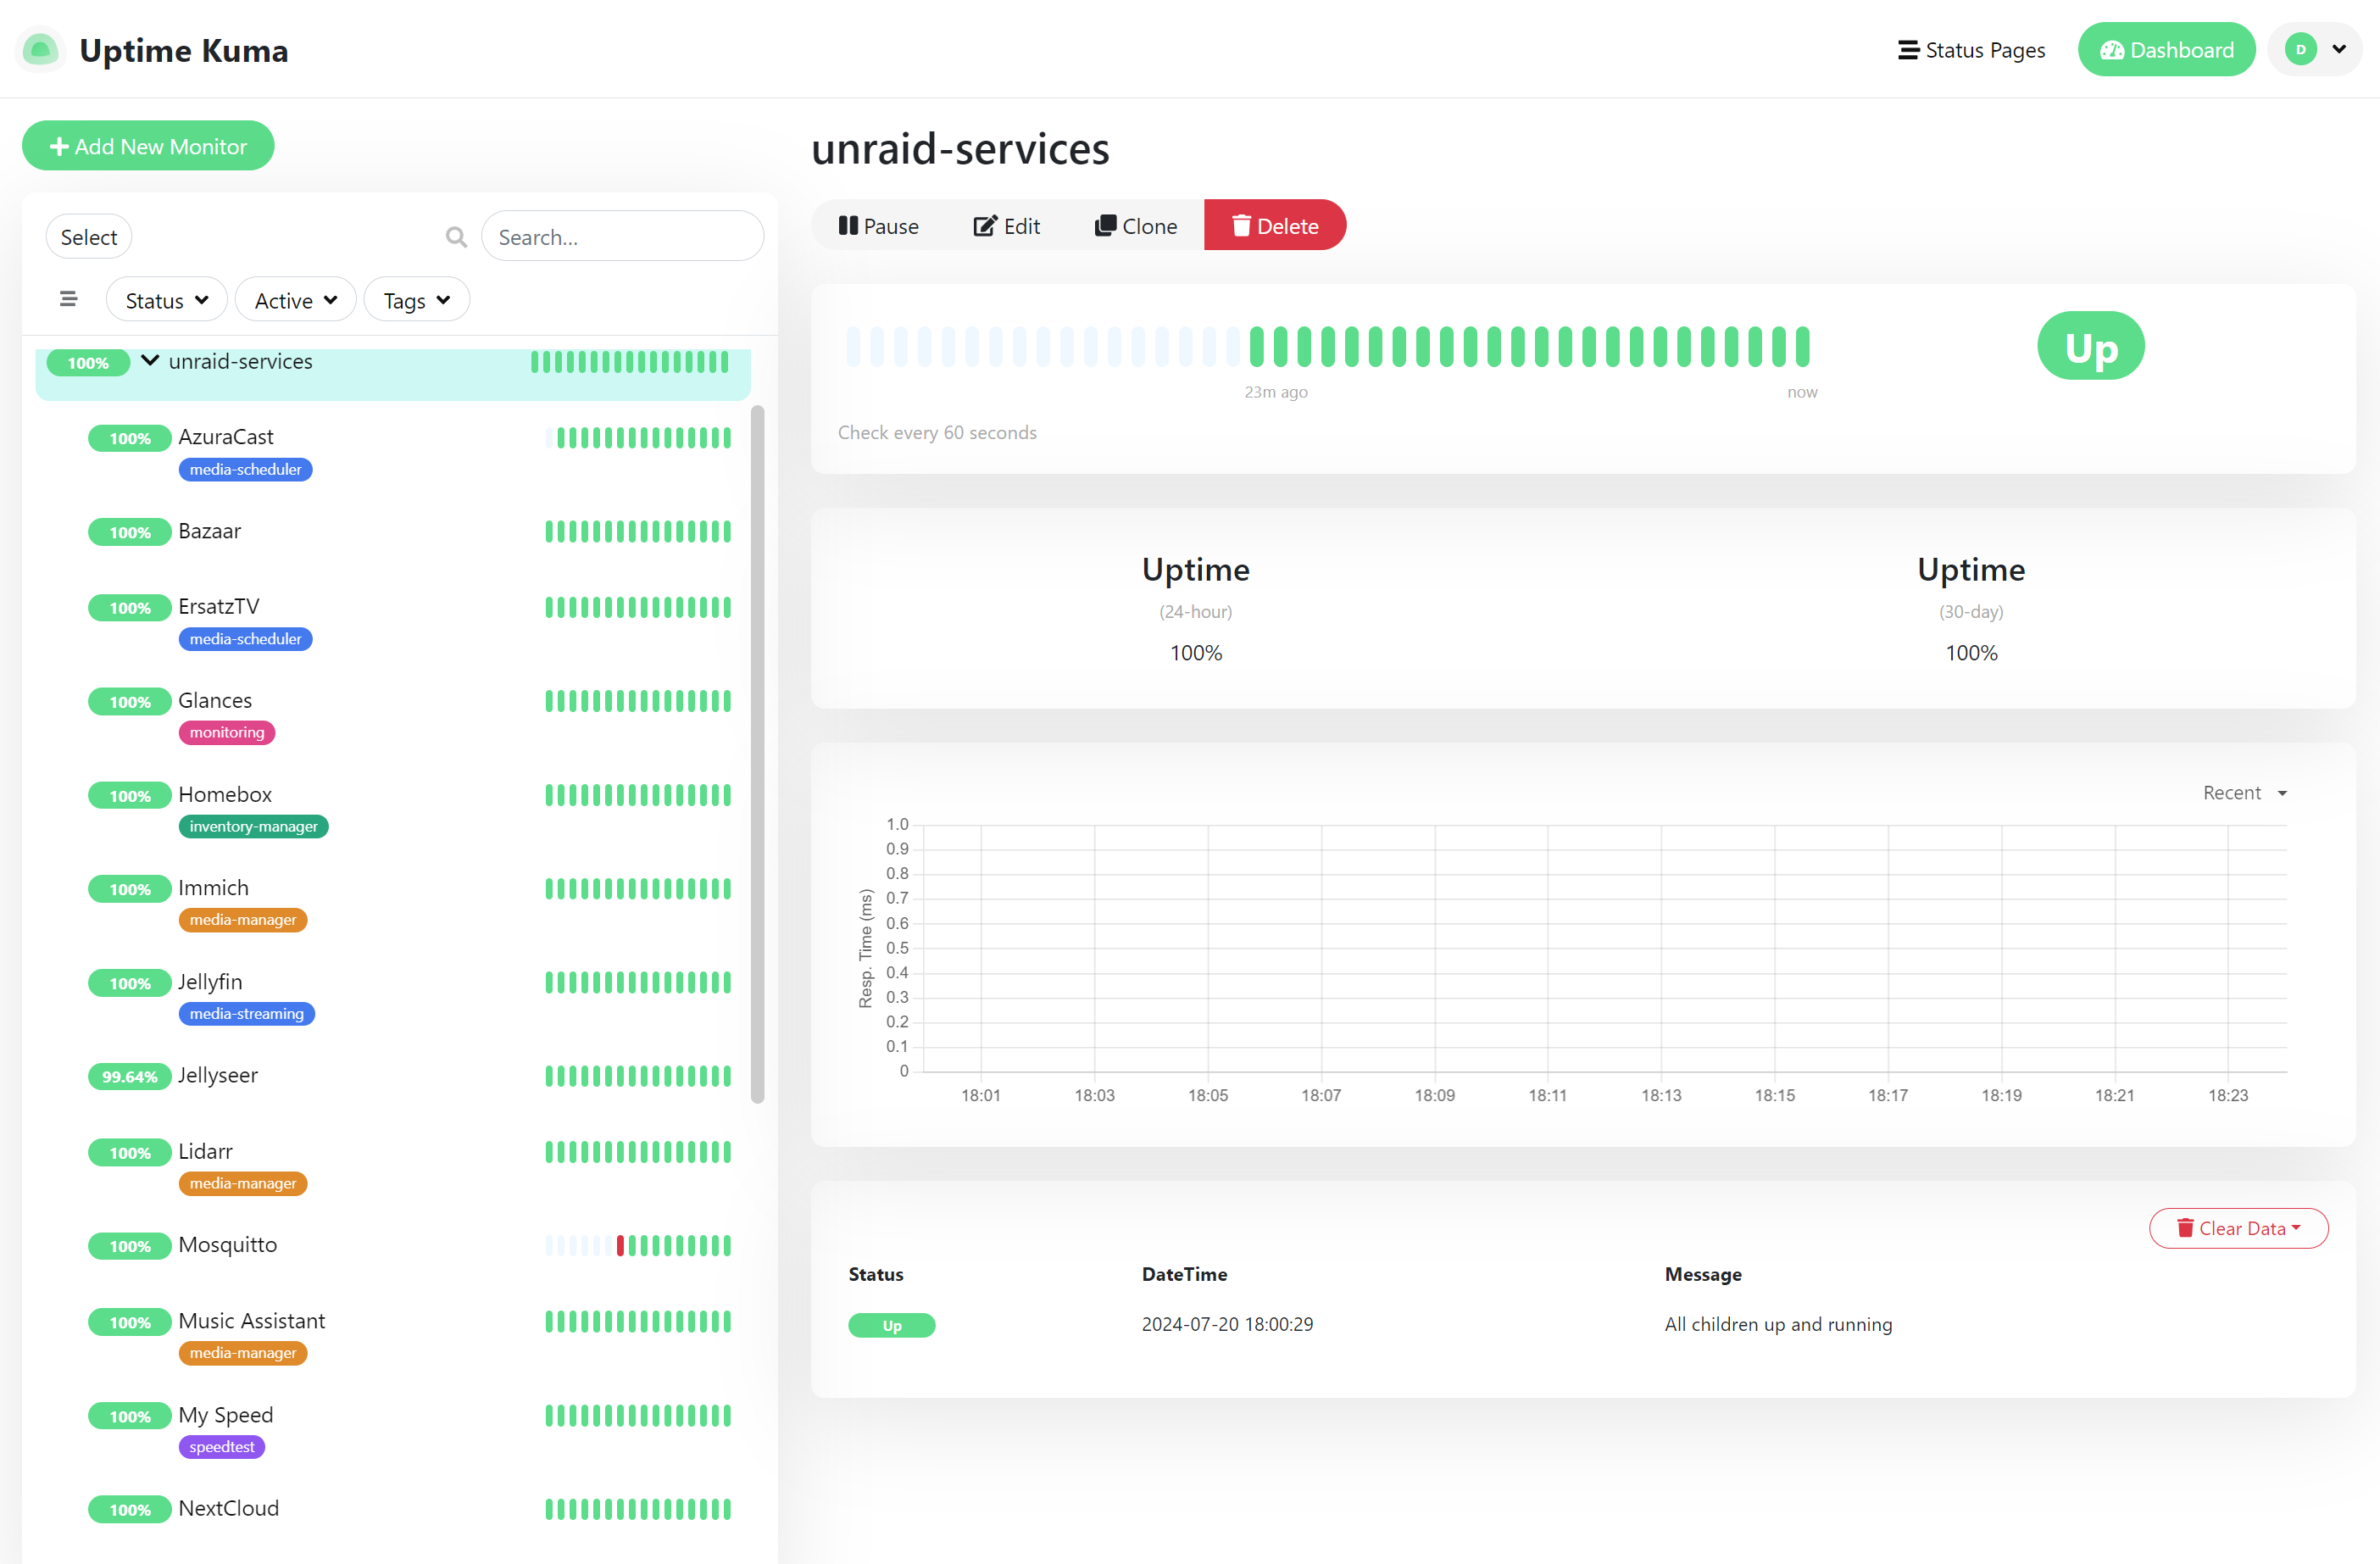
Services running on my unRAID NAS server.
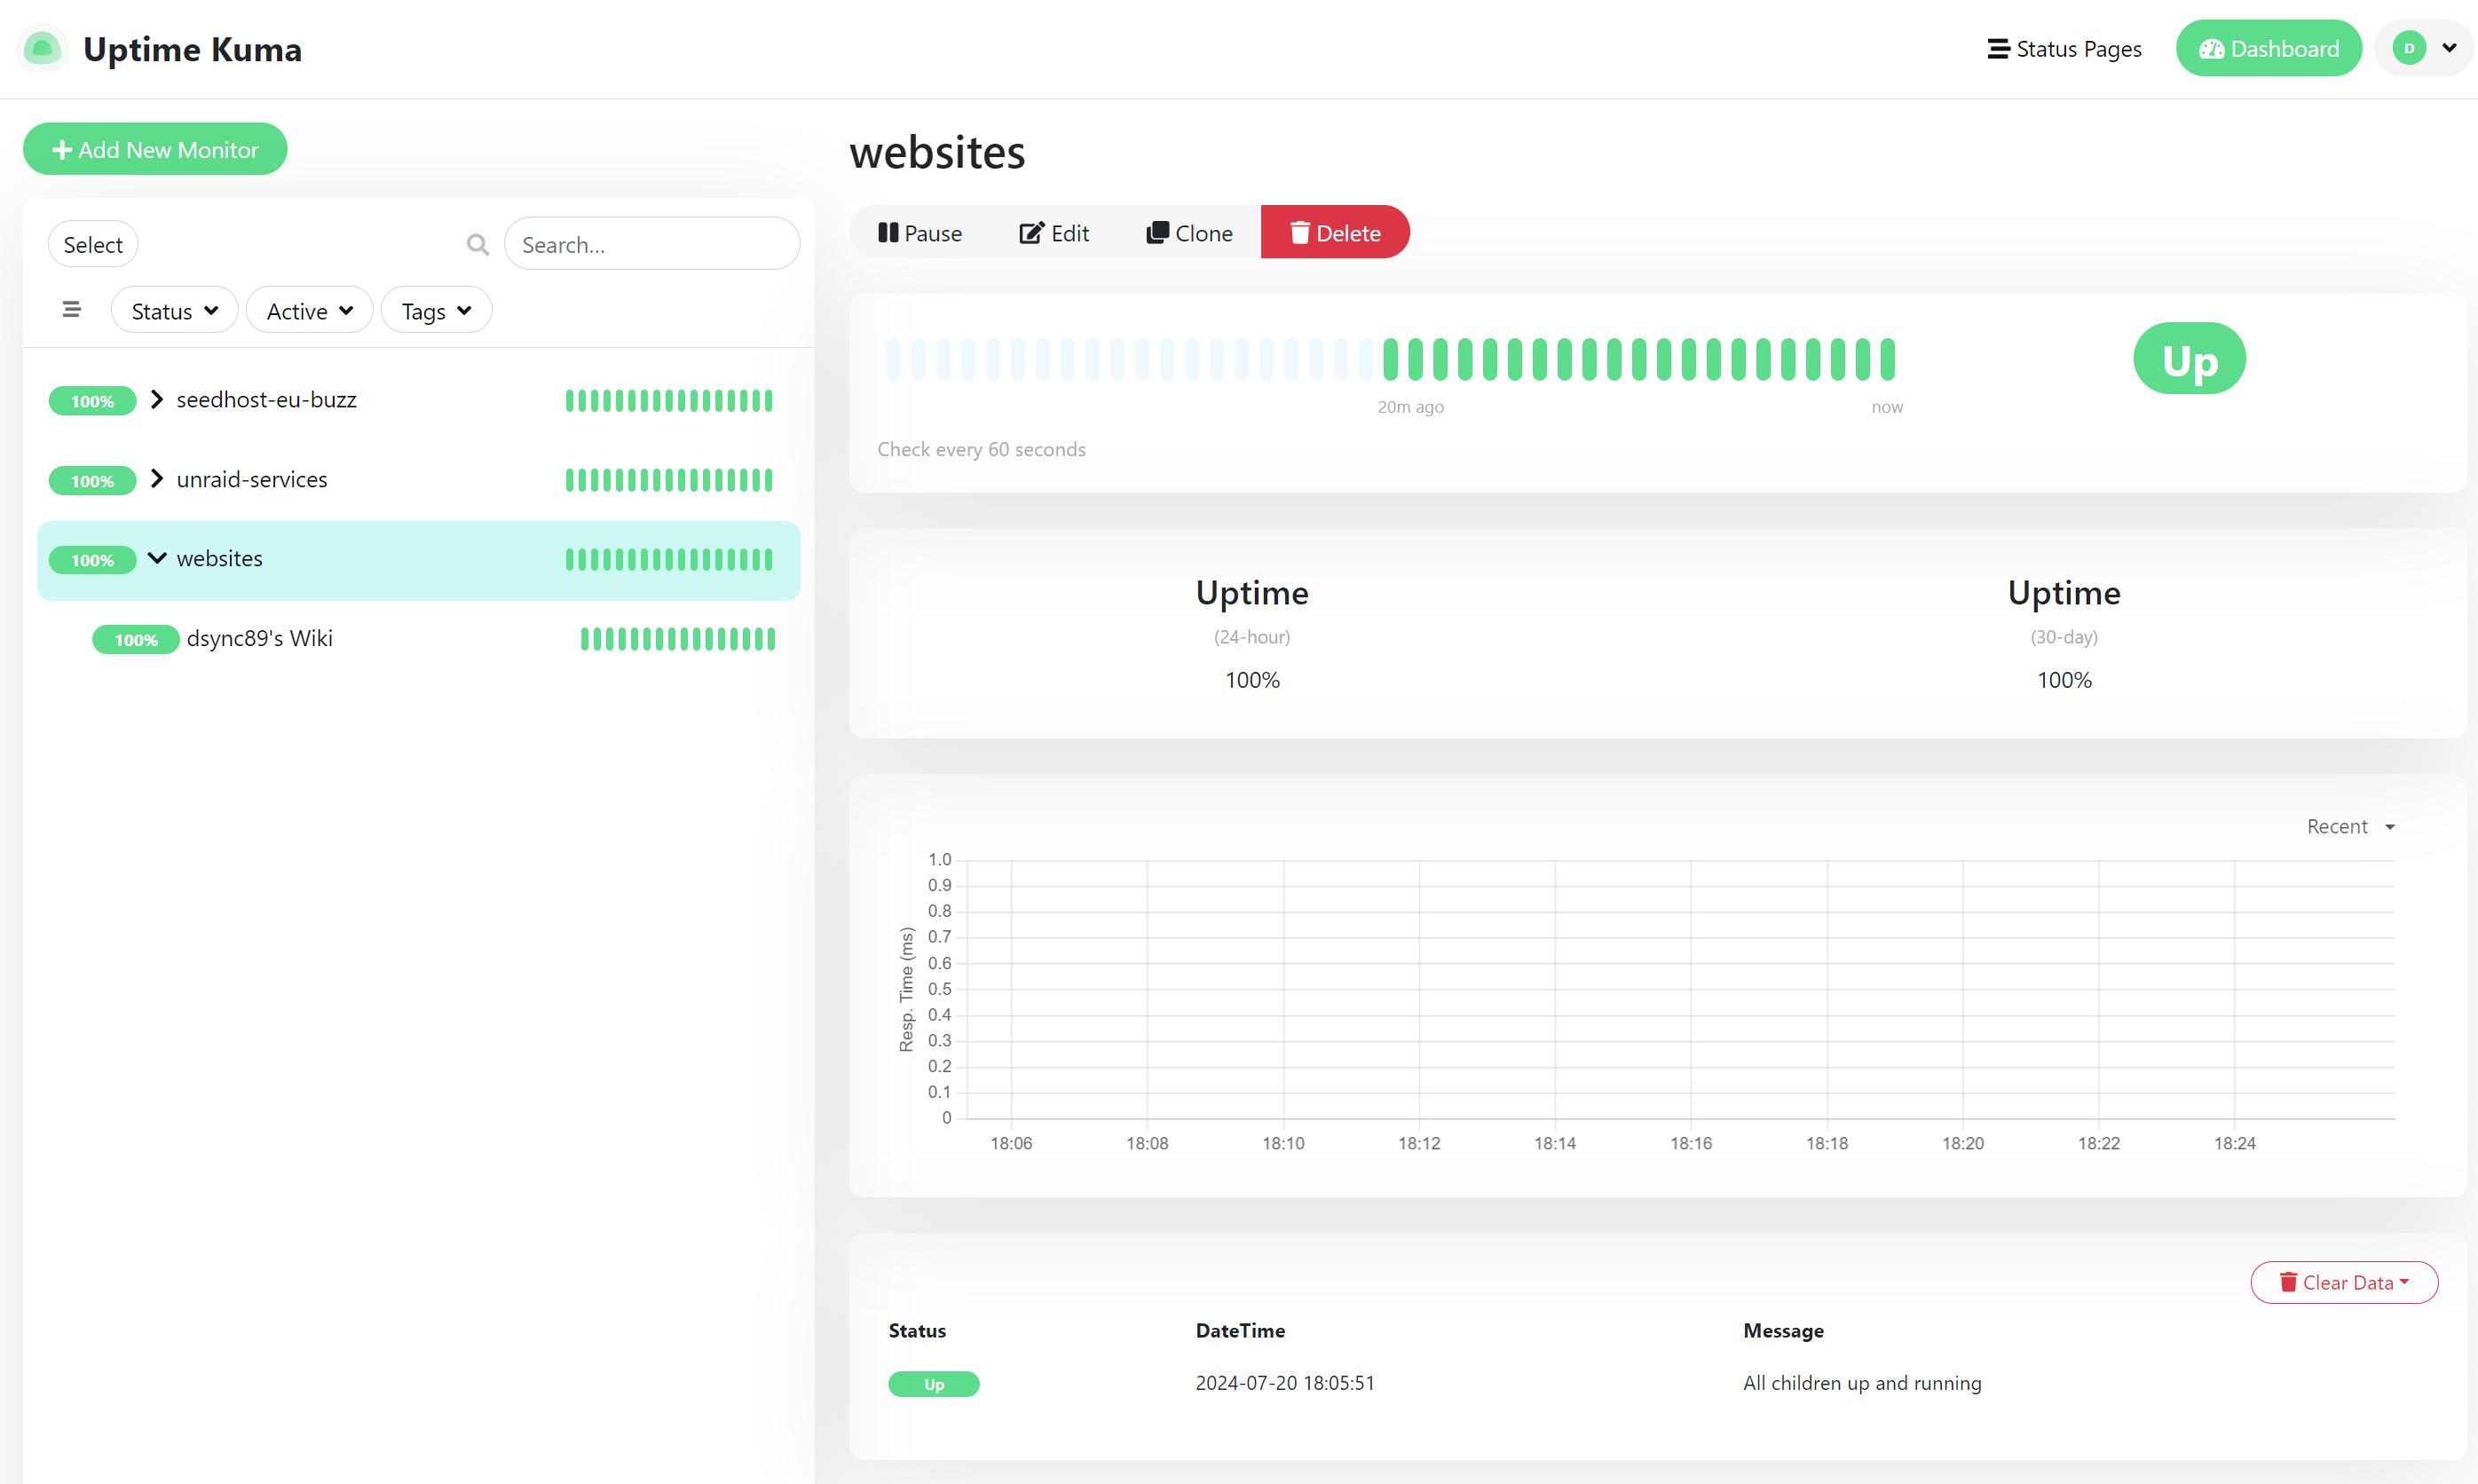
For my website.
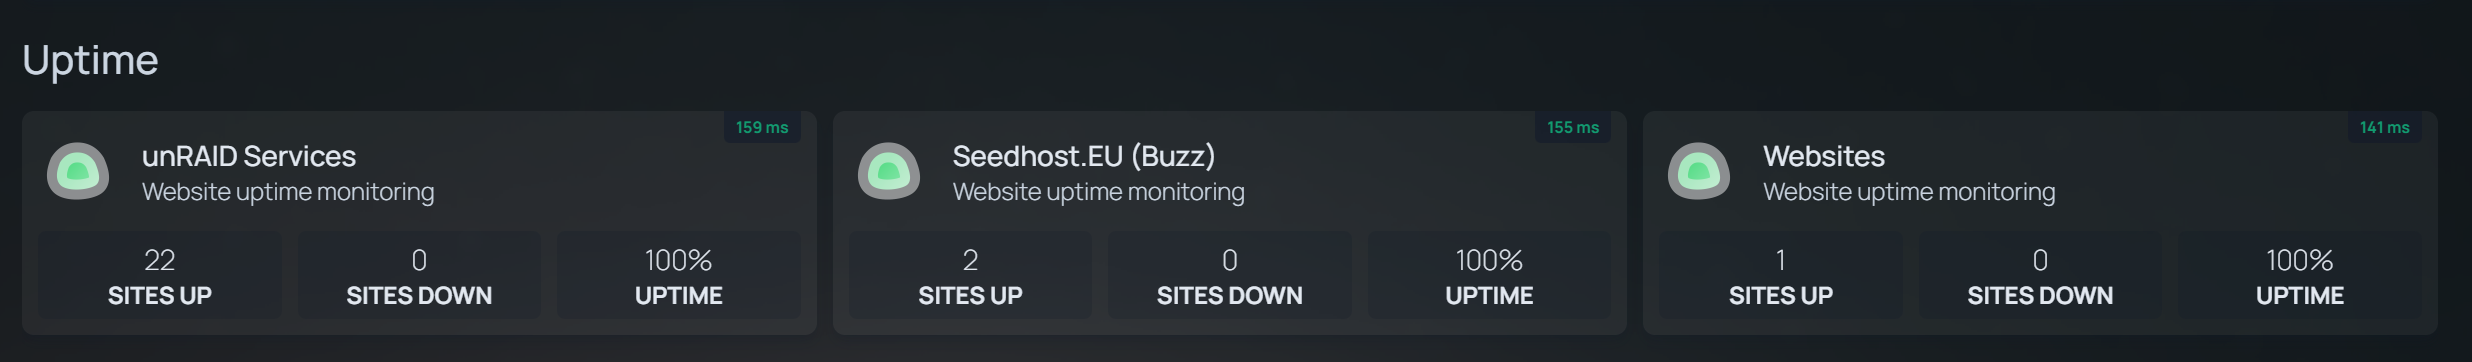
This is how it looks like in GetHomepage, one per Monitor Group.
Integration
GetHomepage Dashboard
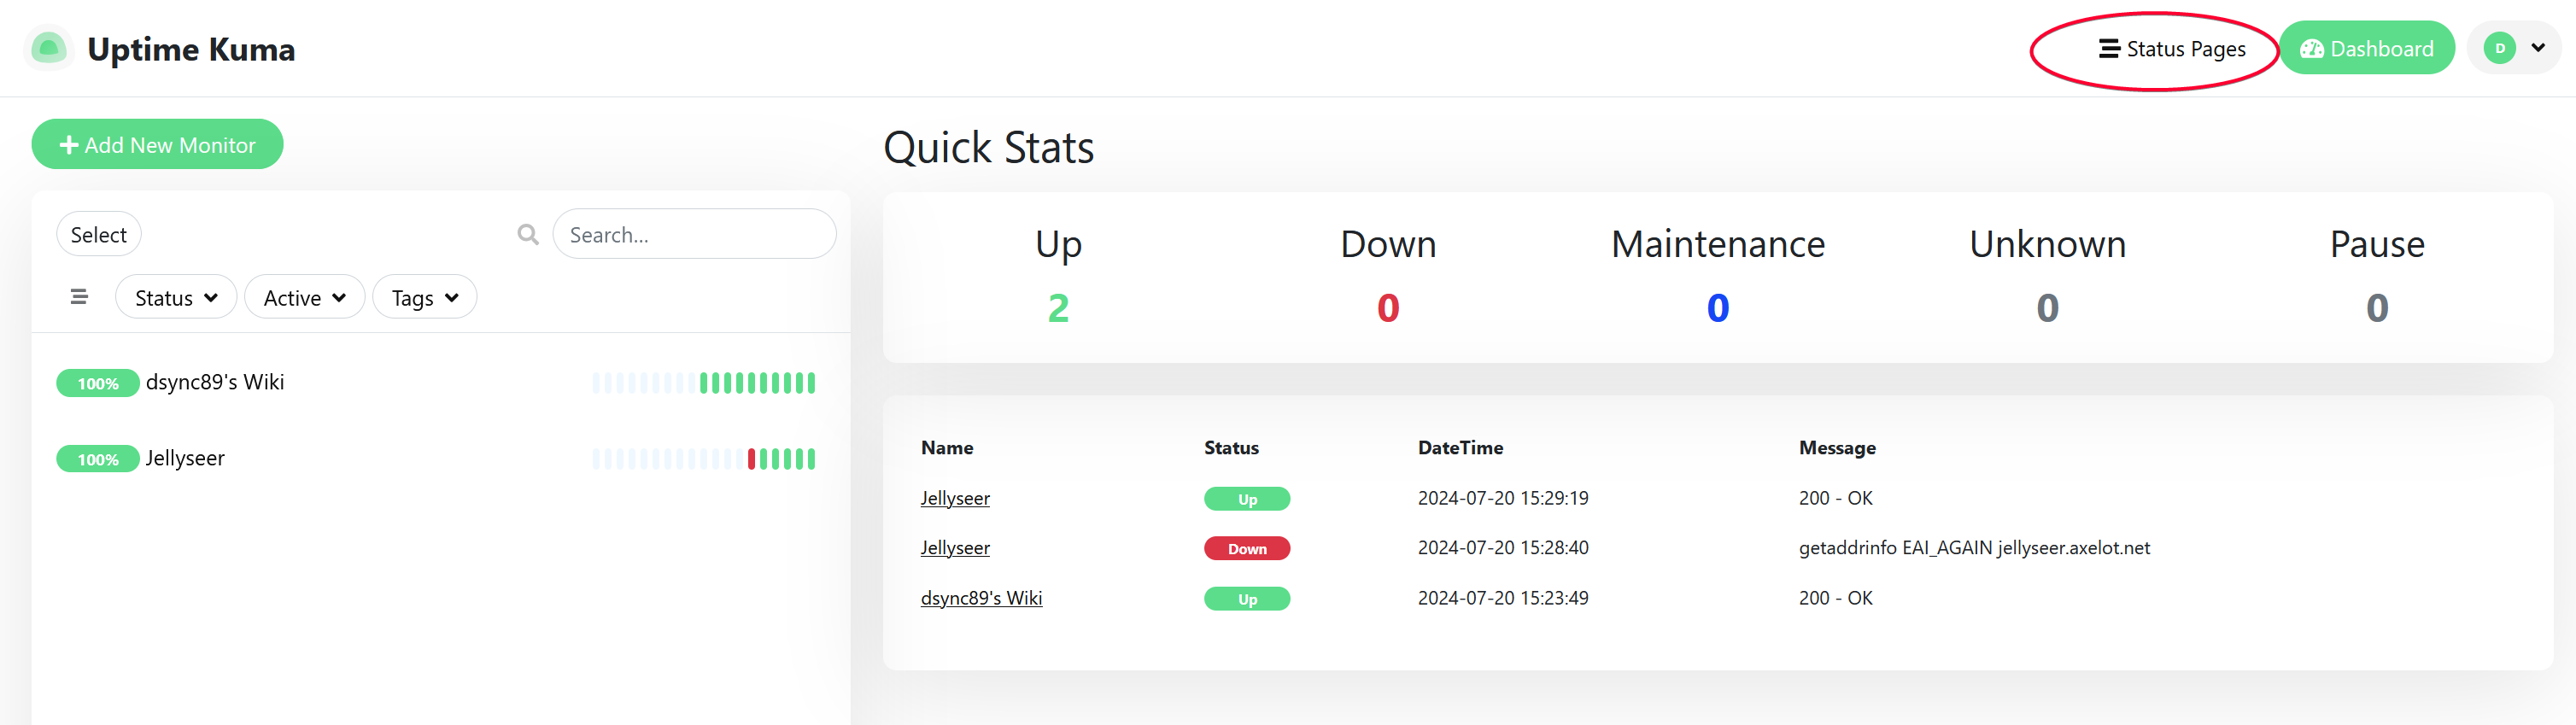
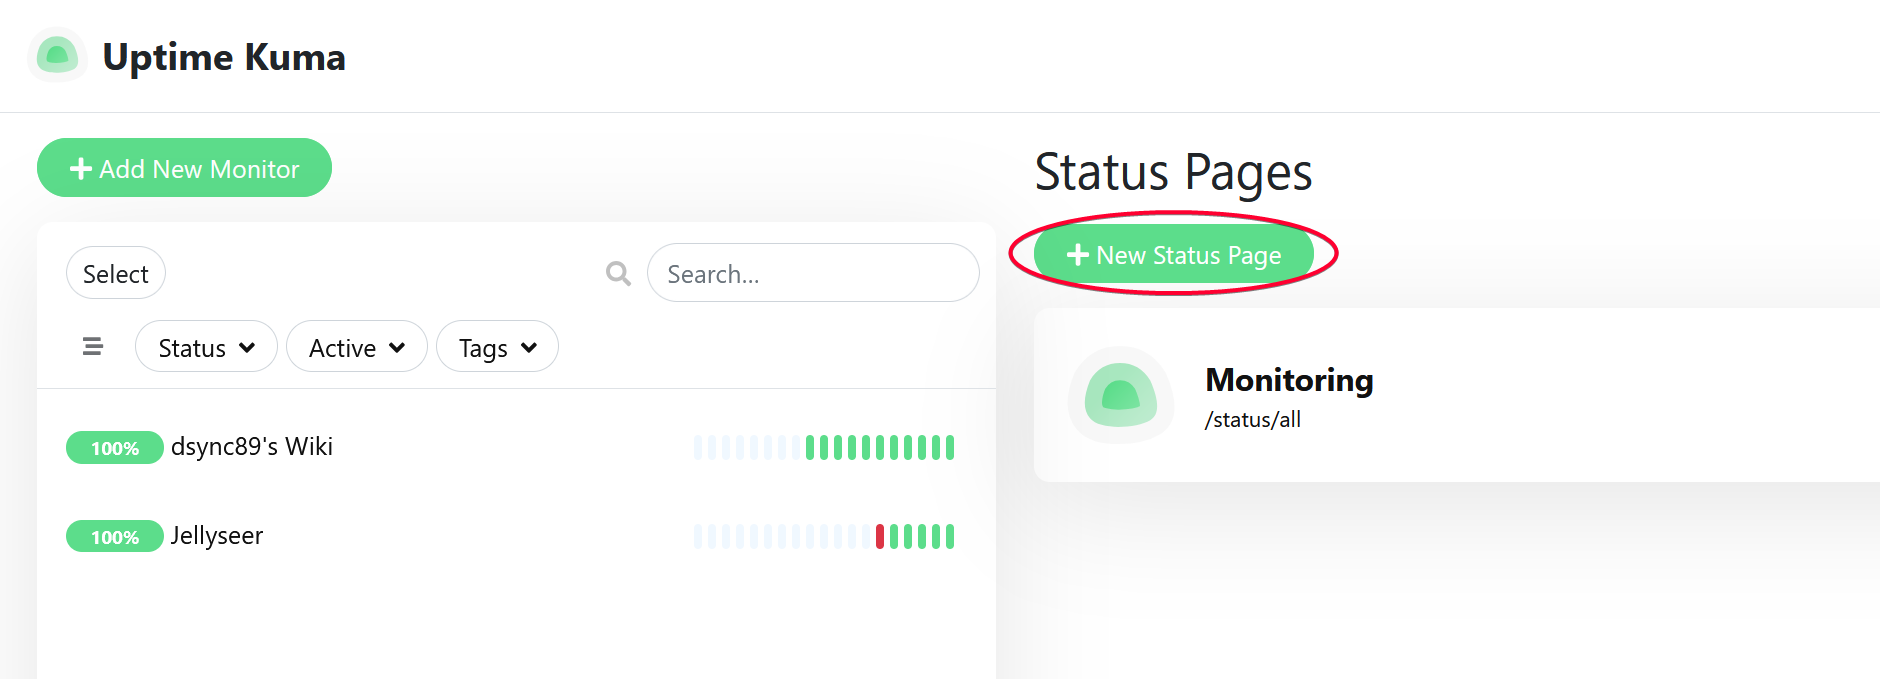
You’ll first have to create a Status page. Go to UptimeKuma web UI and click the Status Page on the top right.
Click New Status Page. The name in theslug matters if you want to integrate with GetHomePage dashboard.
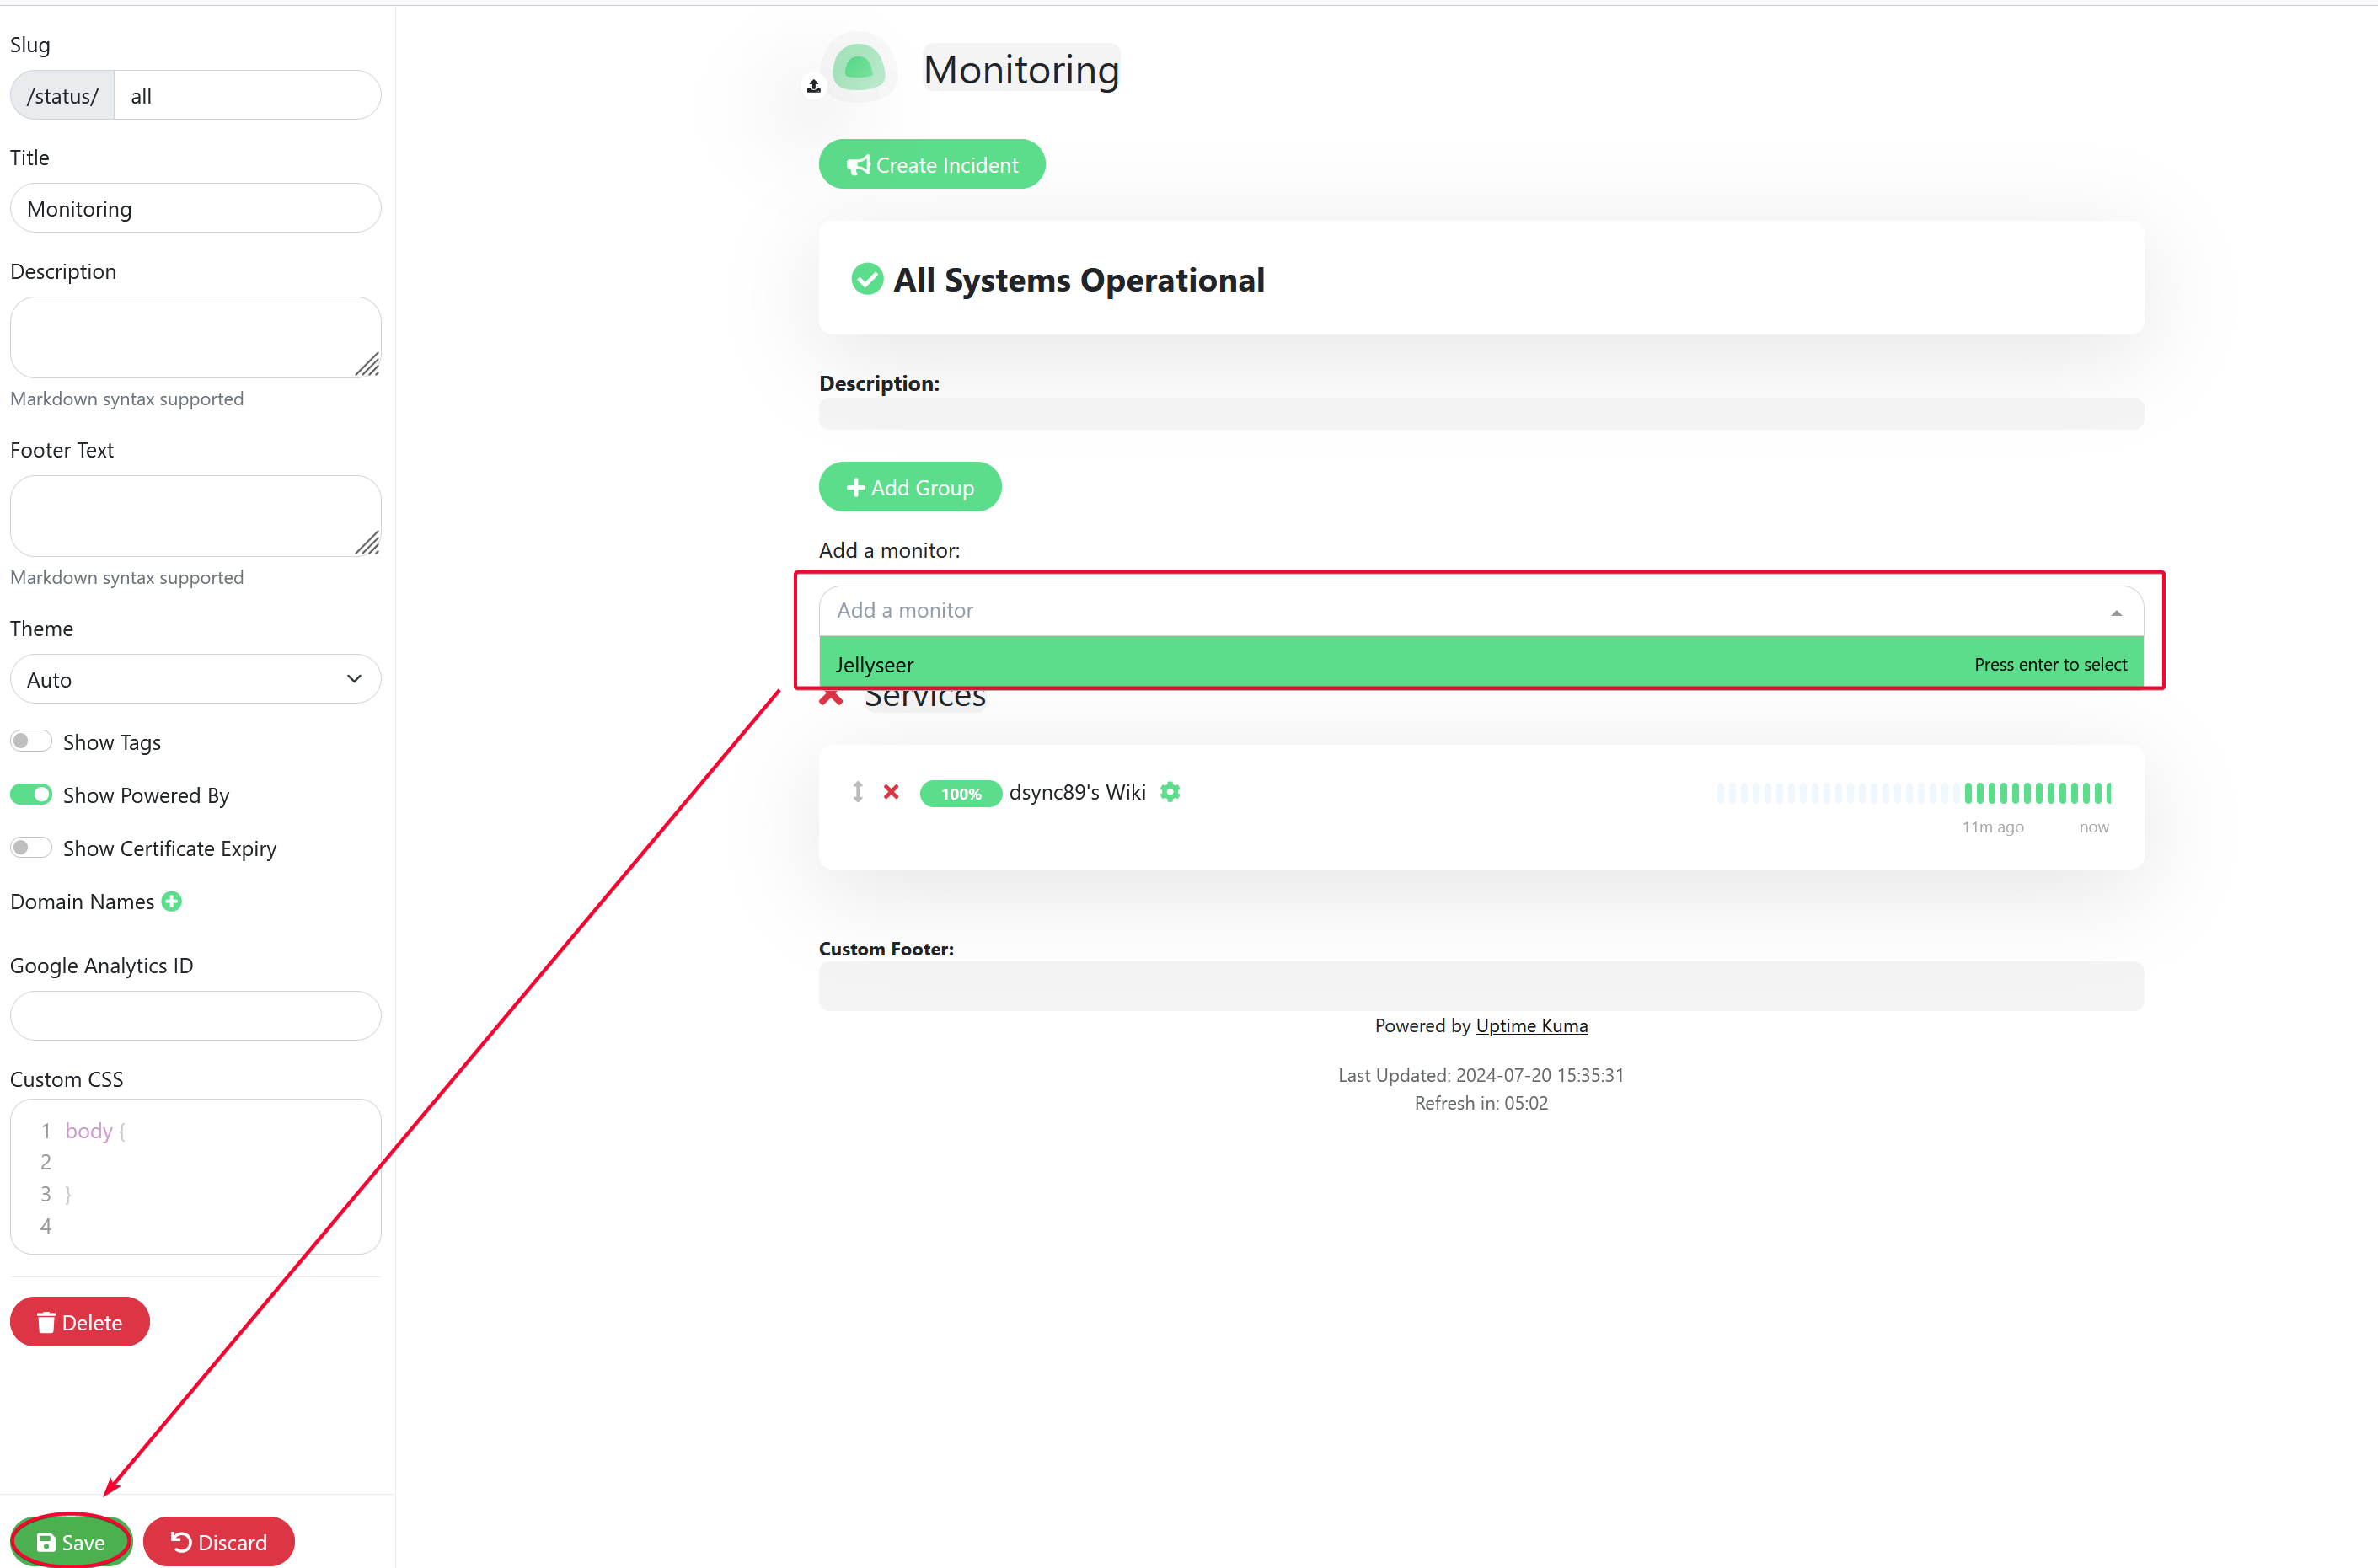
Click the Add a monitor field and select a service to add to this Status page. Click Save button when done.
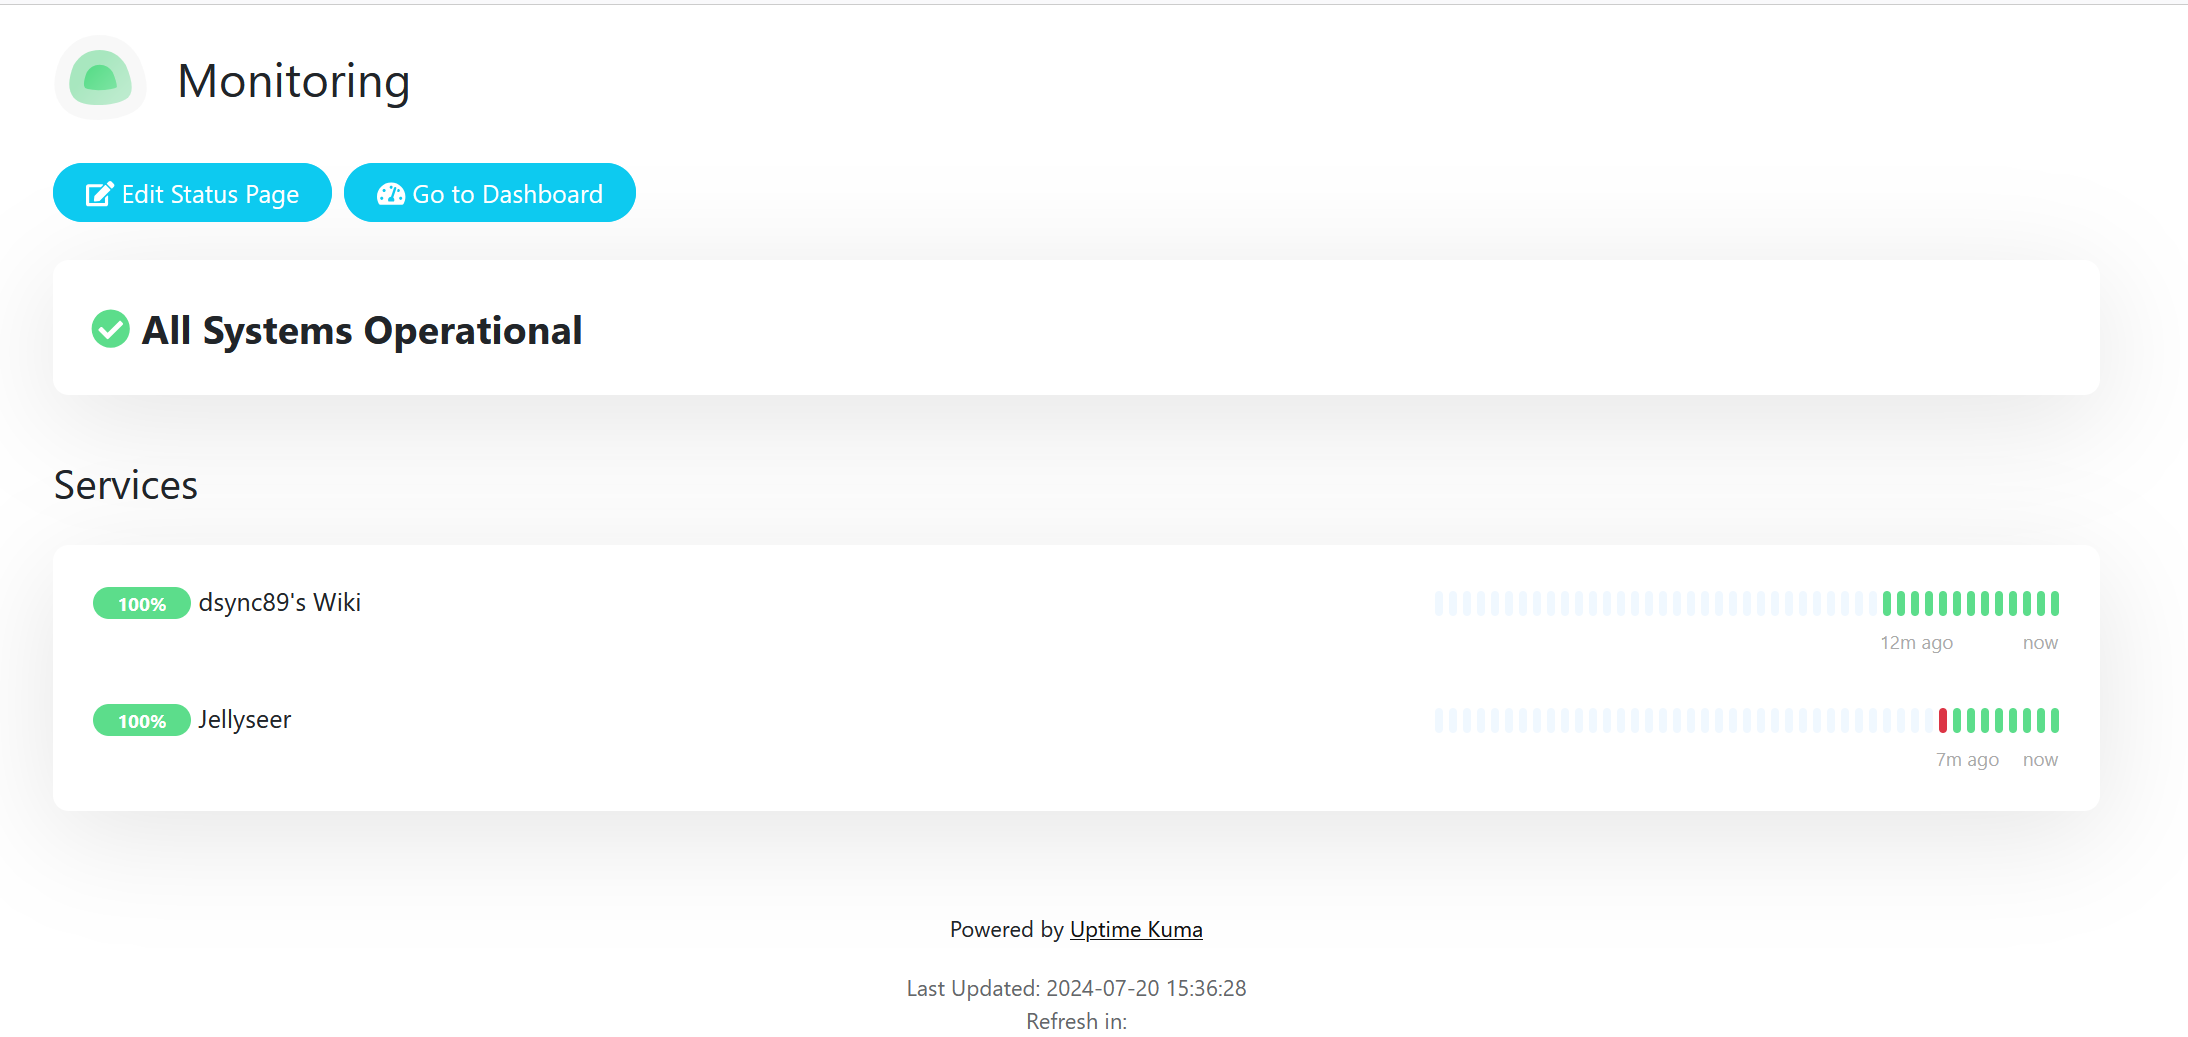
This is how it looks like.
Edit services.yaml in GetHomePage
- Uptime:
- Uptime Kuma:
icon: uptime-kuma.png
href: http://192.168.1.26:3001
description: Website uptime monitoring
siteMonitor: http://192.168.1.26:3001
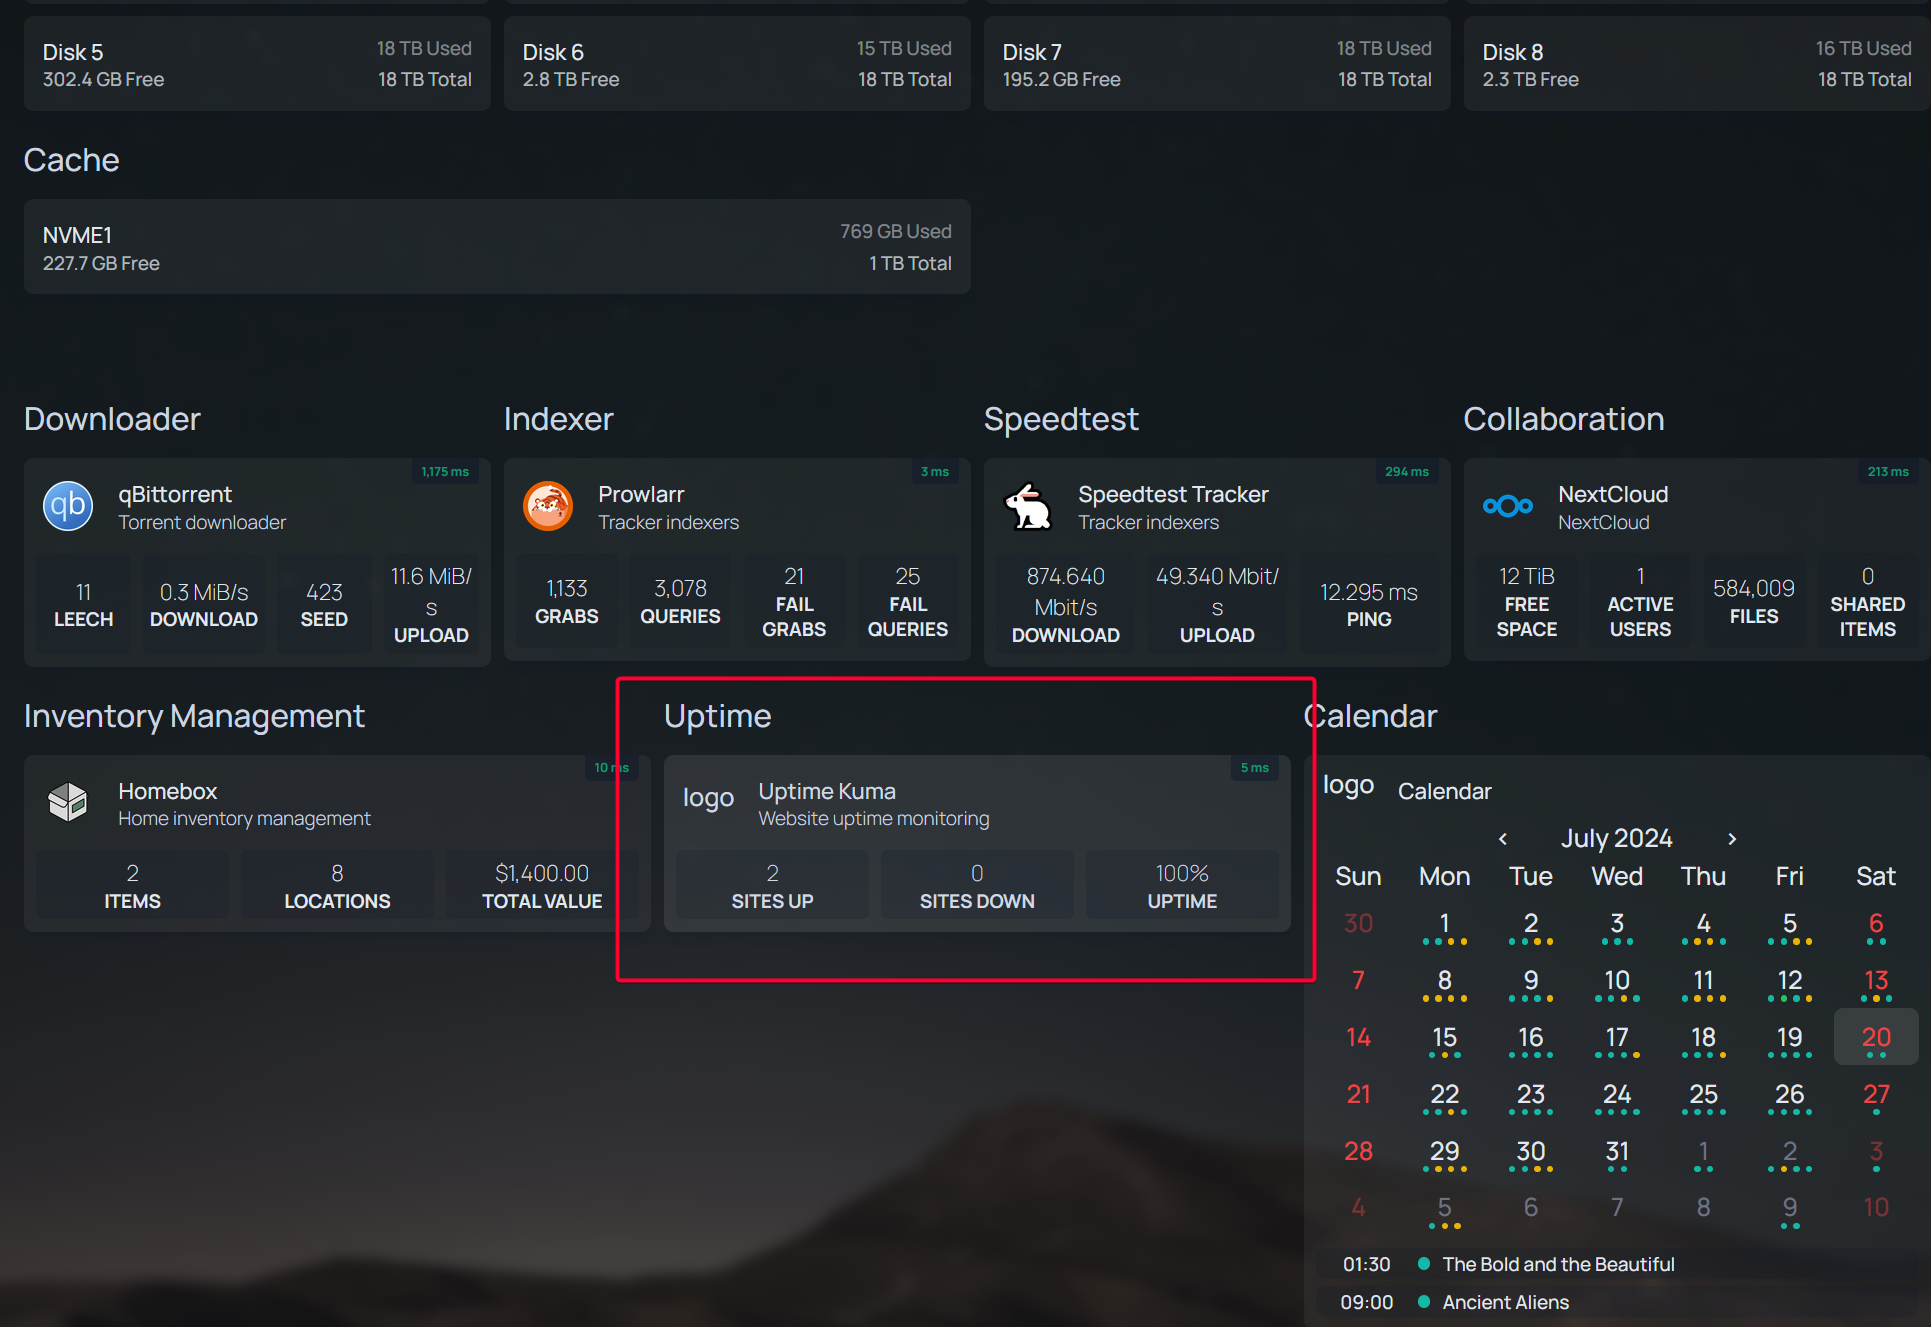
widget:
type: uptimekuma
url: http://192.168.1.26:3001
slug: allThis is how it looks like after integrating with GetHomepage dashboard.